


IoT | La estación meteorológica TensorFlow predice la intensidad de la lluvia
Componentes y suministros
| × | 1 | ||||
 |
| × | 1 | |||
| × | 1 | ||||
 |
| × | 1 | |||
 |
| × | 1 | |||
 |
| × | 1 | |||
 |
| × | 2 |
Herramientas y máquinas necesarias
 |
|
Aplicaciones y servicios en línea
 |
| |||
 |
| |||
 |
|
Acerca de este proyecto
Especialmente en 2020, lluvias intensas y violentas instantáneas han causado efectos perjudiciales en los invernaderos y el rendimiento de los cultivos en mi país. Desafortunadamente, en estos días las lluvias inesperadas y excesivas ocurren con mayor frecuencia y se volvieron relativamente comunes debido al cambio climático en algunas áreas. Mientras tanto, otras regiones sufren sequías. A medida que pasa el 2020, se registran en mi región más de treinta y cinco incidentes que provocaron la pérdida de cultivos y ganado por lluvias intensas y violentas. Para contribuir a la solución de frenar y evitar problemas provocados por lluvias excesivas como la pérdida de productividad agrícola, contemplé este proyecto como punto de partida.
Principalmente, me concentré en los efectos de las lluvias excesivas en la agricultura en este proyecto. Sin embargo, las lluvias excesivas pueden generar numerosos peligros, por ejemplo [1]:
- inundaciones, incluido el riesgo para la vida humana,
- daños a edificios e infraestructura,
- pérdida de cultivos y ganado,
- deslizamientos de tierra, que pueden amenazar la vida humana, interrumpir el transporte y las comunicaciones.
Como se muestra en los últimos estudios, las lluvias excesivas pueden afectar la productividad de los cultivos de varias maneras, incluido el daño físico directo, el retraso en la siembra y la cosecha, el crecimiento restringido de las raíces, la deficiencia de oxígeno y la pérdida de nutrientes. Por lo tanto, demasiada lluvia puede ser tan peligrosa como la sequía para la agricultura: "Los datos de las últimas tres décadas sugieren que las lluvias excesivas pueden afectar el rendimiento de los cultivos tanto como el calor y la sequía excesivos. En un nuevo estudio, un equipo interdisciplinario del La Universidad de Illinois vinculó los datos de seguros de cosechas, clima, suelo y rendimiento de maíz desde 1981 hasta 2016. El estudio encontró que, durante algunos años, las lluvias excesivas redujeron el rendimiento de maíz de EE. UU. Hasta en un 34% en relación con el rendimiento esperado. Los datos sugieren que la sequía y el calor excesivo provocaron una pérdida de rendimiento de hasta un 37% durante algunos años [2] " .
Desafortunadamente, los sistemas de alerta temprana no son suficientes para prevenir por completo los efectos exacerbados de las lluvias excesivas en los productos y procesos agrícolas sin datos meteorológicos locales preliminares y adecuados para cada invernadero o granja. Por lo tanto, con la esperanza de evitar los efectos perjudiciales de las lluvias excesivas en la agricultura, decidí crear este proyecto como una estación meteorológica remota y económica para recopilar e interpretar información meteorológica local para hacer predicciones más precisas sobre la intensidad de la lluvia.
Después de investigar un poco sobre el aprendizaje profundo y las redes neuronales, decidí construir una red neuronal artificial (ANN) basada en el modelo de clasificación para interpretar los datos meteorológicos locales acumulados para predecir la intensidad de la lluvia de acuerdo con las clases dadas. Como indica el siguiente estudio, los investigadores han aplicado diferentes modelos y tipos de redes neuronales para pronosticar no solo las lluvias sino también los fenómenos meteorológicos: "Muchos experimentos han utilizado redes neuronales para predecir cantidades cuantitativas de lluvia en varios lugares y rangos de anticipación. Por ejemplo, los investigadores en Tailandia pudieron obtener pronósticos altamente precisos utilizando redes neuronales de retroalimentación para predecir cantidades cuantitativas de lluvia en el rango de anticipación de una a tres horas con el fin de predecir posibles peligros de inundaciones. Las redes neuronales también se han utilizado para predecir fenómenos meteorológicos además de los valores de pronóstico tradicionales, como probabilidad / cantidad de lluvia, velocidad del viento, presión barométrica, etc. Se han utilizado con mucho éxito para predecir tornados. Además, investigadores en Australia utilizaron con éxito una red neuronal para identificar la niebla en varios pronósticos rangos que van desde 3 horas a 18 horas alrededor del Aeropuerto Internacional de Canberra [3]. "
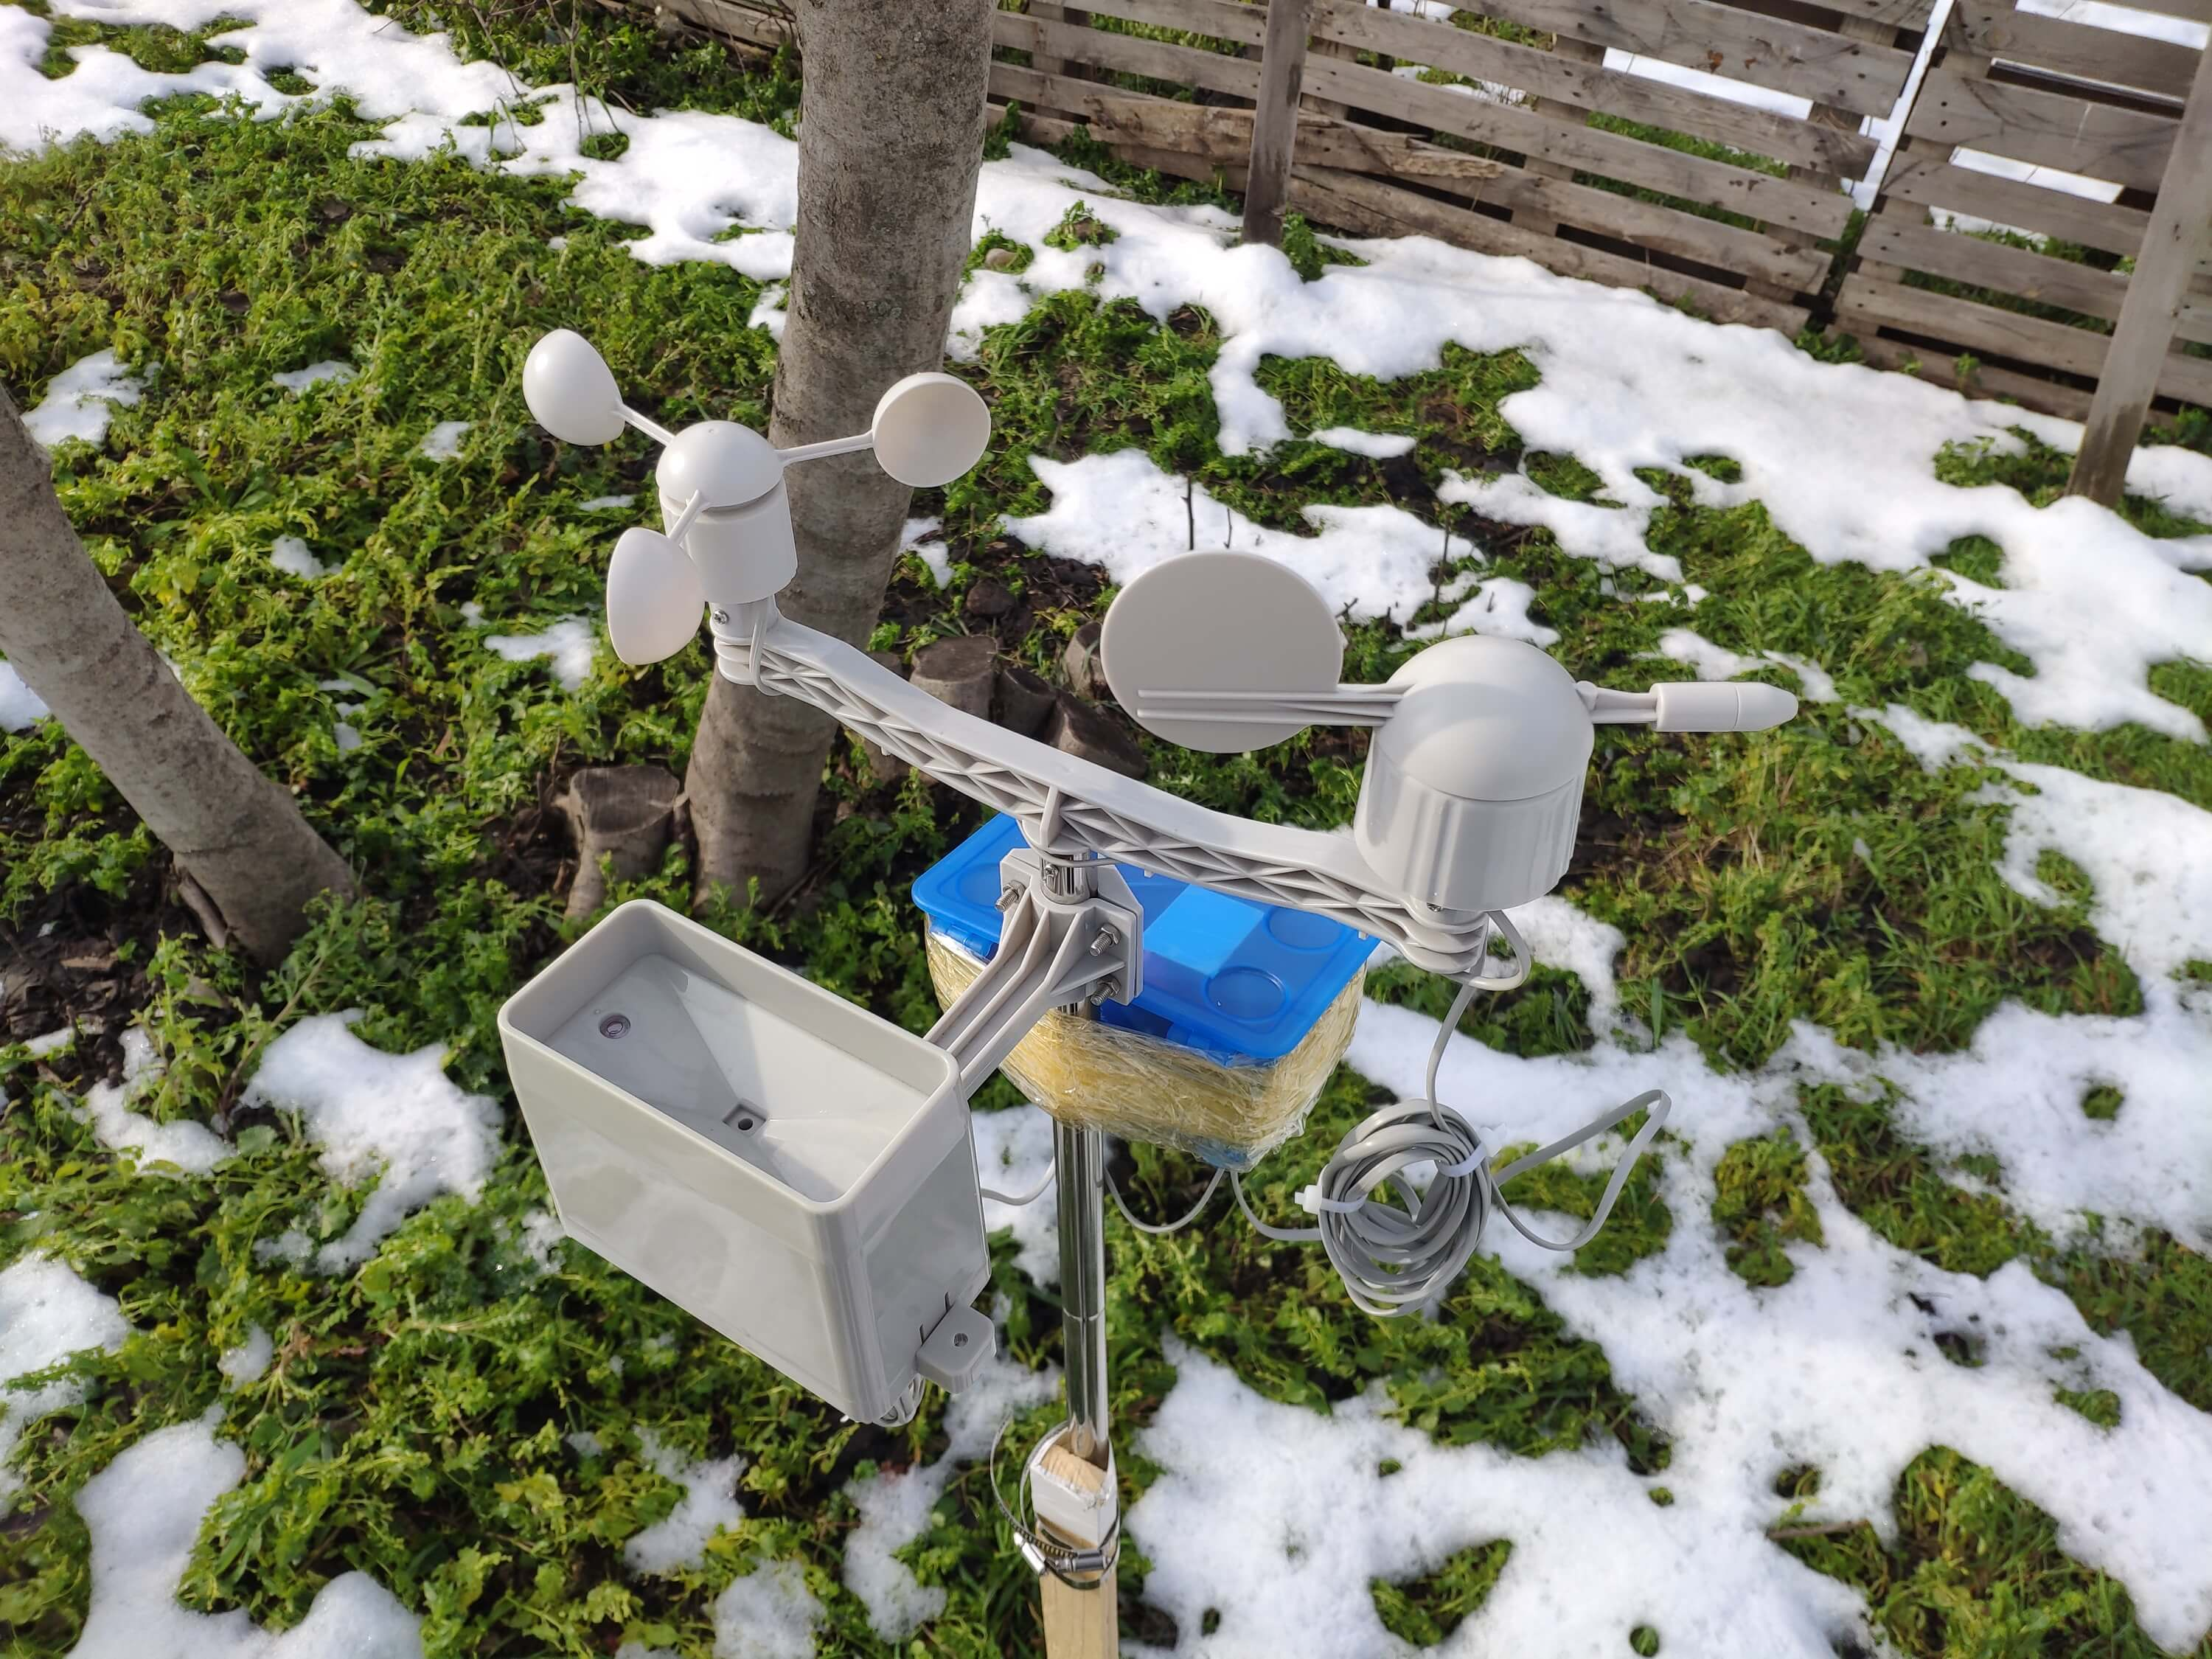
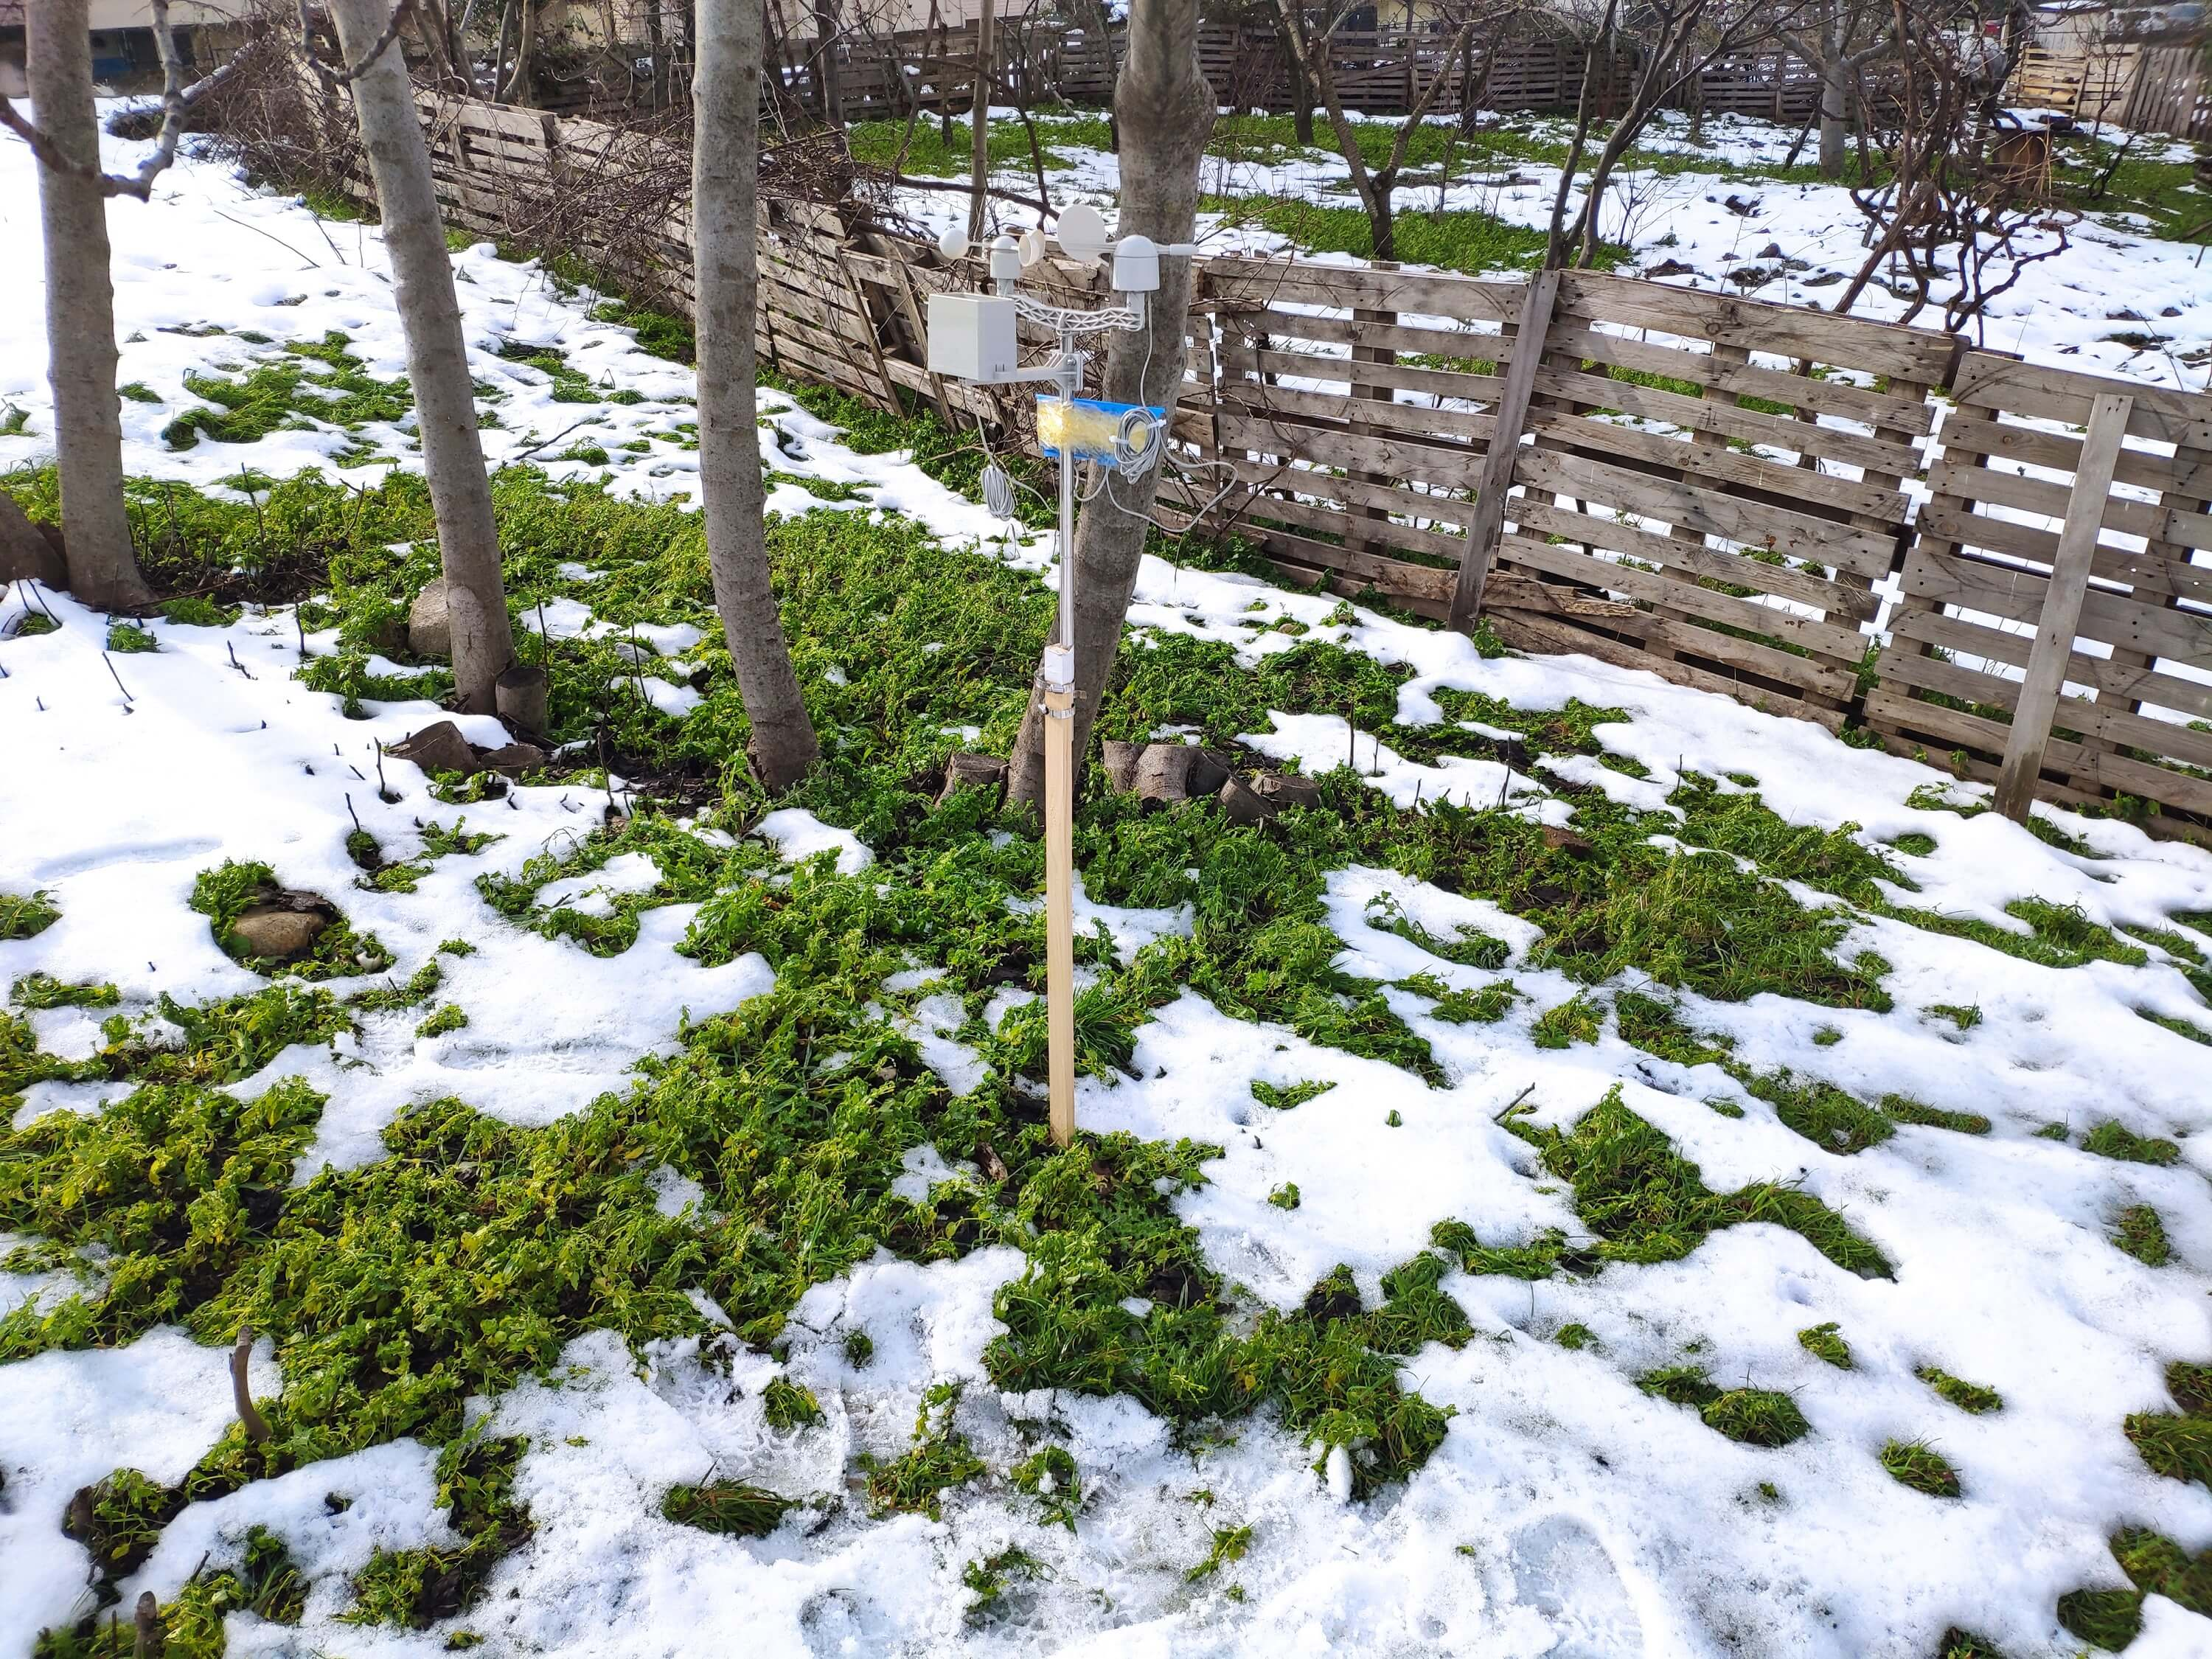
Antes de construir y probar mi modelo de red neuronal, había recopilado datos meteorológicos en mi balcón y patio trasero en un radio de tres kilómetros durante más de tres meses para crear un conjunto de datos meteorológicos locales que mostraran información meteorológica en mi vecindario. Para poder obtener información meteorológica incluso en condiciones meteorológicas extremas, utilicé un kit de estación meteorológica con anemómetro, veleta y cubo de lluvia de DFRobot con dos placas de desarrollo diferentes:
- NodeMCU ESP-12E (habilitado para WiFi)
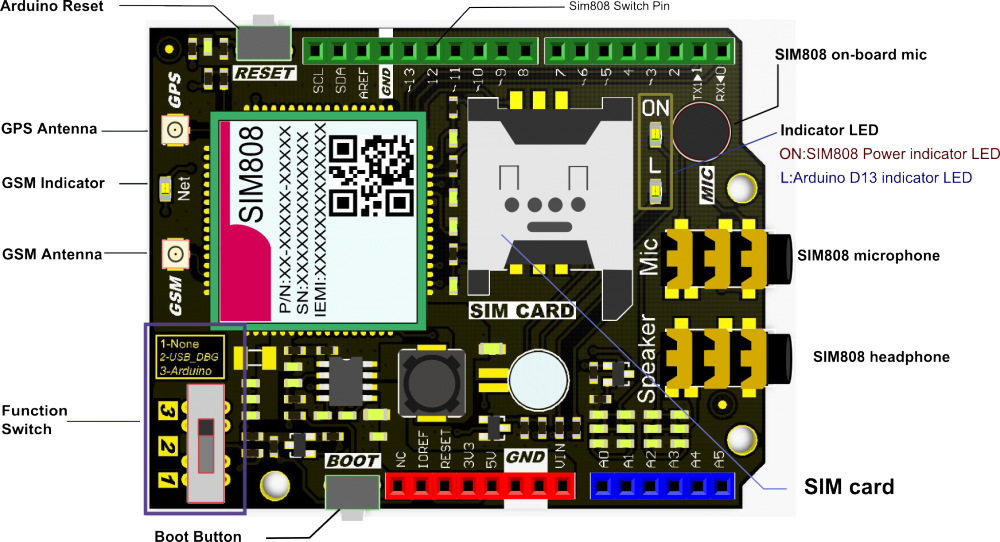
- Arduino Uno + DFRobot SIM808 GPS / GPRS / GSM Shield (habilitado para GPRS)
Por lo tanto, podría transferir datos meteorológicos a través de WiFi en mi balcón o GPRS si la distancia entre mi enrutador y la estación meteorológica es demasiado grande.
Decidí usar Google Sheets, un programa de hojas de cálculo basado en la nube, para recopilar datos meteorológicos generados por la estación meteorológica porque crear grandes conjuntos de datos y agregar nueva información es simple con la API de Google Sheets. Por lo tanto, desarrollé una aplicación web en PHP para obtener datos meteorológicos transferidos por las placas de desarrollo y agregarlos a una hoja de cálculo en Google Sheets.
Después de completar la recopilación de datos meteorológicos durante más de tres meses cada cinco minutos, construí un modelo de red neuronal artificial (ANN) con TensorFlow para hacer predicciones sobre la intensidad de la lluvia. Teóricamente, asigné una clase de intensidad de lluvia para cada lectura después de escalar y normalizar el conjunto de datos. Luego, entrené el modelo de red neuronal para clasificar estas clases:
- Sin lluvia
- Lluvia ligera
- Lluvia moderada
- Lluvias intensas
- Lluvia violenta
Entonces, este es mi proyecto en pocas palabras 😃
En los siguientes pasos, puede encontrar información más detallada sobre la codificación, la recopilación de datos meteorológicos locales y la creación de un modelo de red neuronal artificial (ANN) con TensorFlow.
Muchas gracias a DFRobot por patrocinar este proyecto.
Productos patrocinados por DFRobot:
⭐ Kit de estación meteorológica con anemómetro / veleta / cubo de lluvia | Inspeccionar
⭐ Escudo SIM808 GPS / GPRS / GSM para Arduino | Inspeccionar
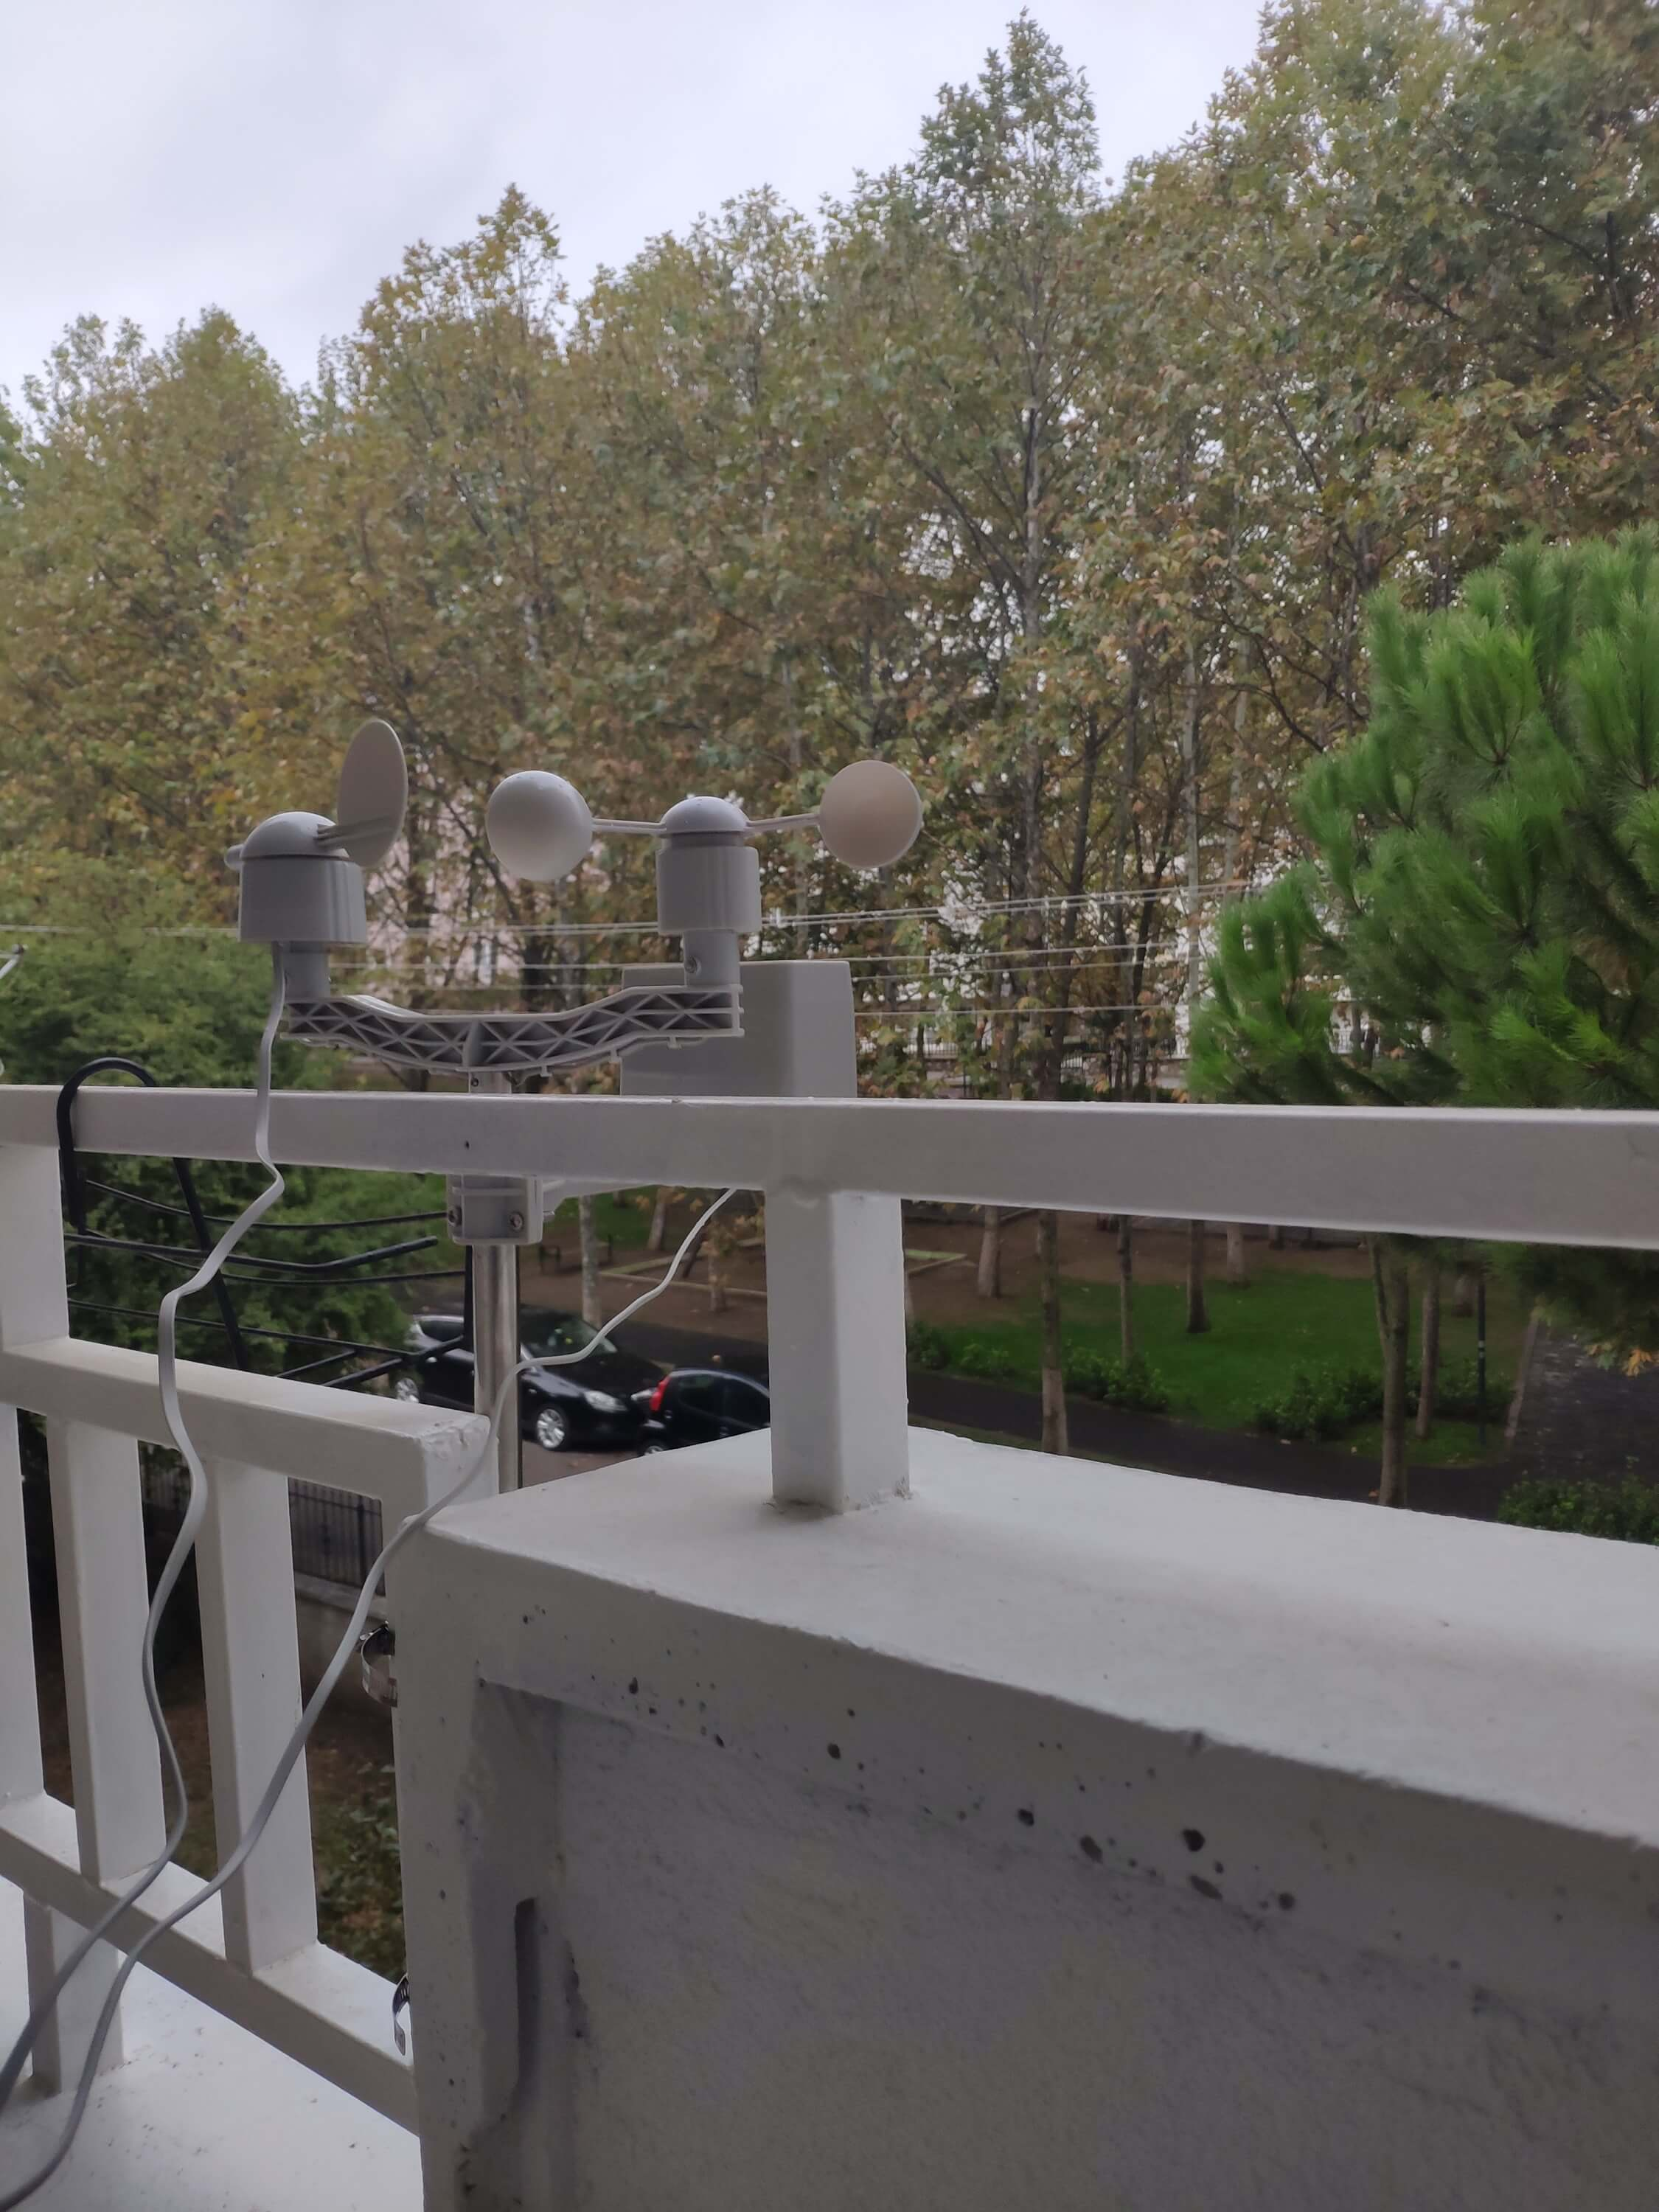
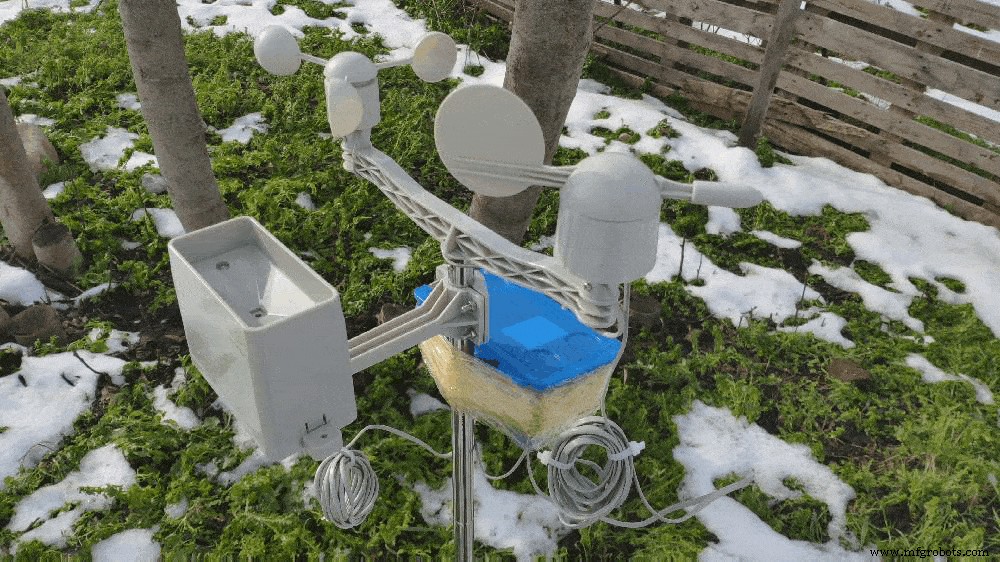
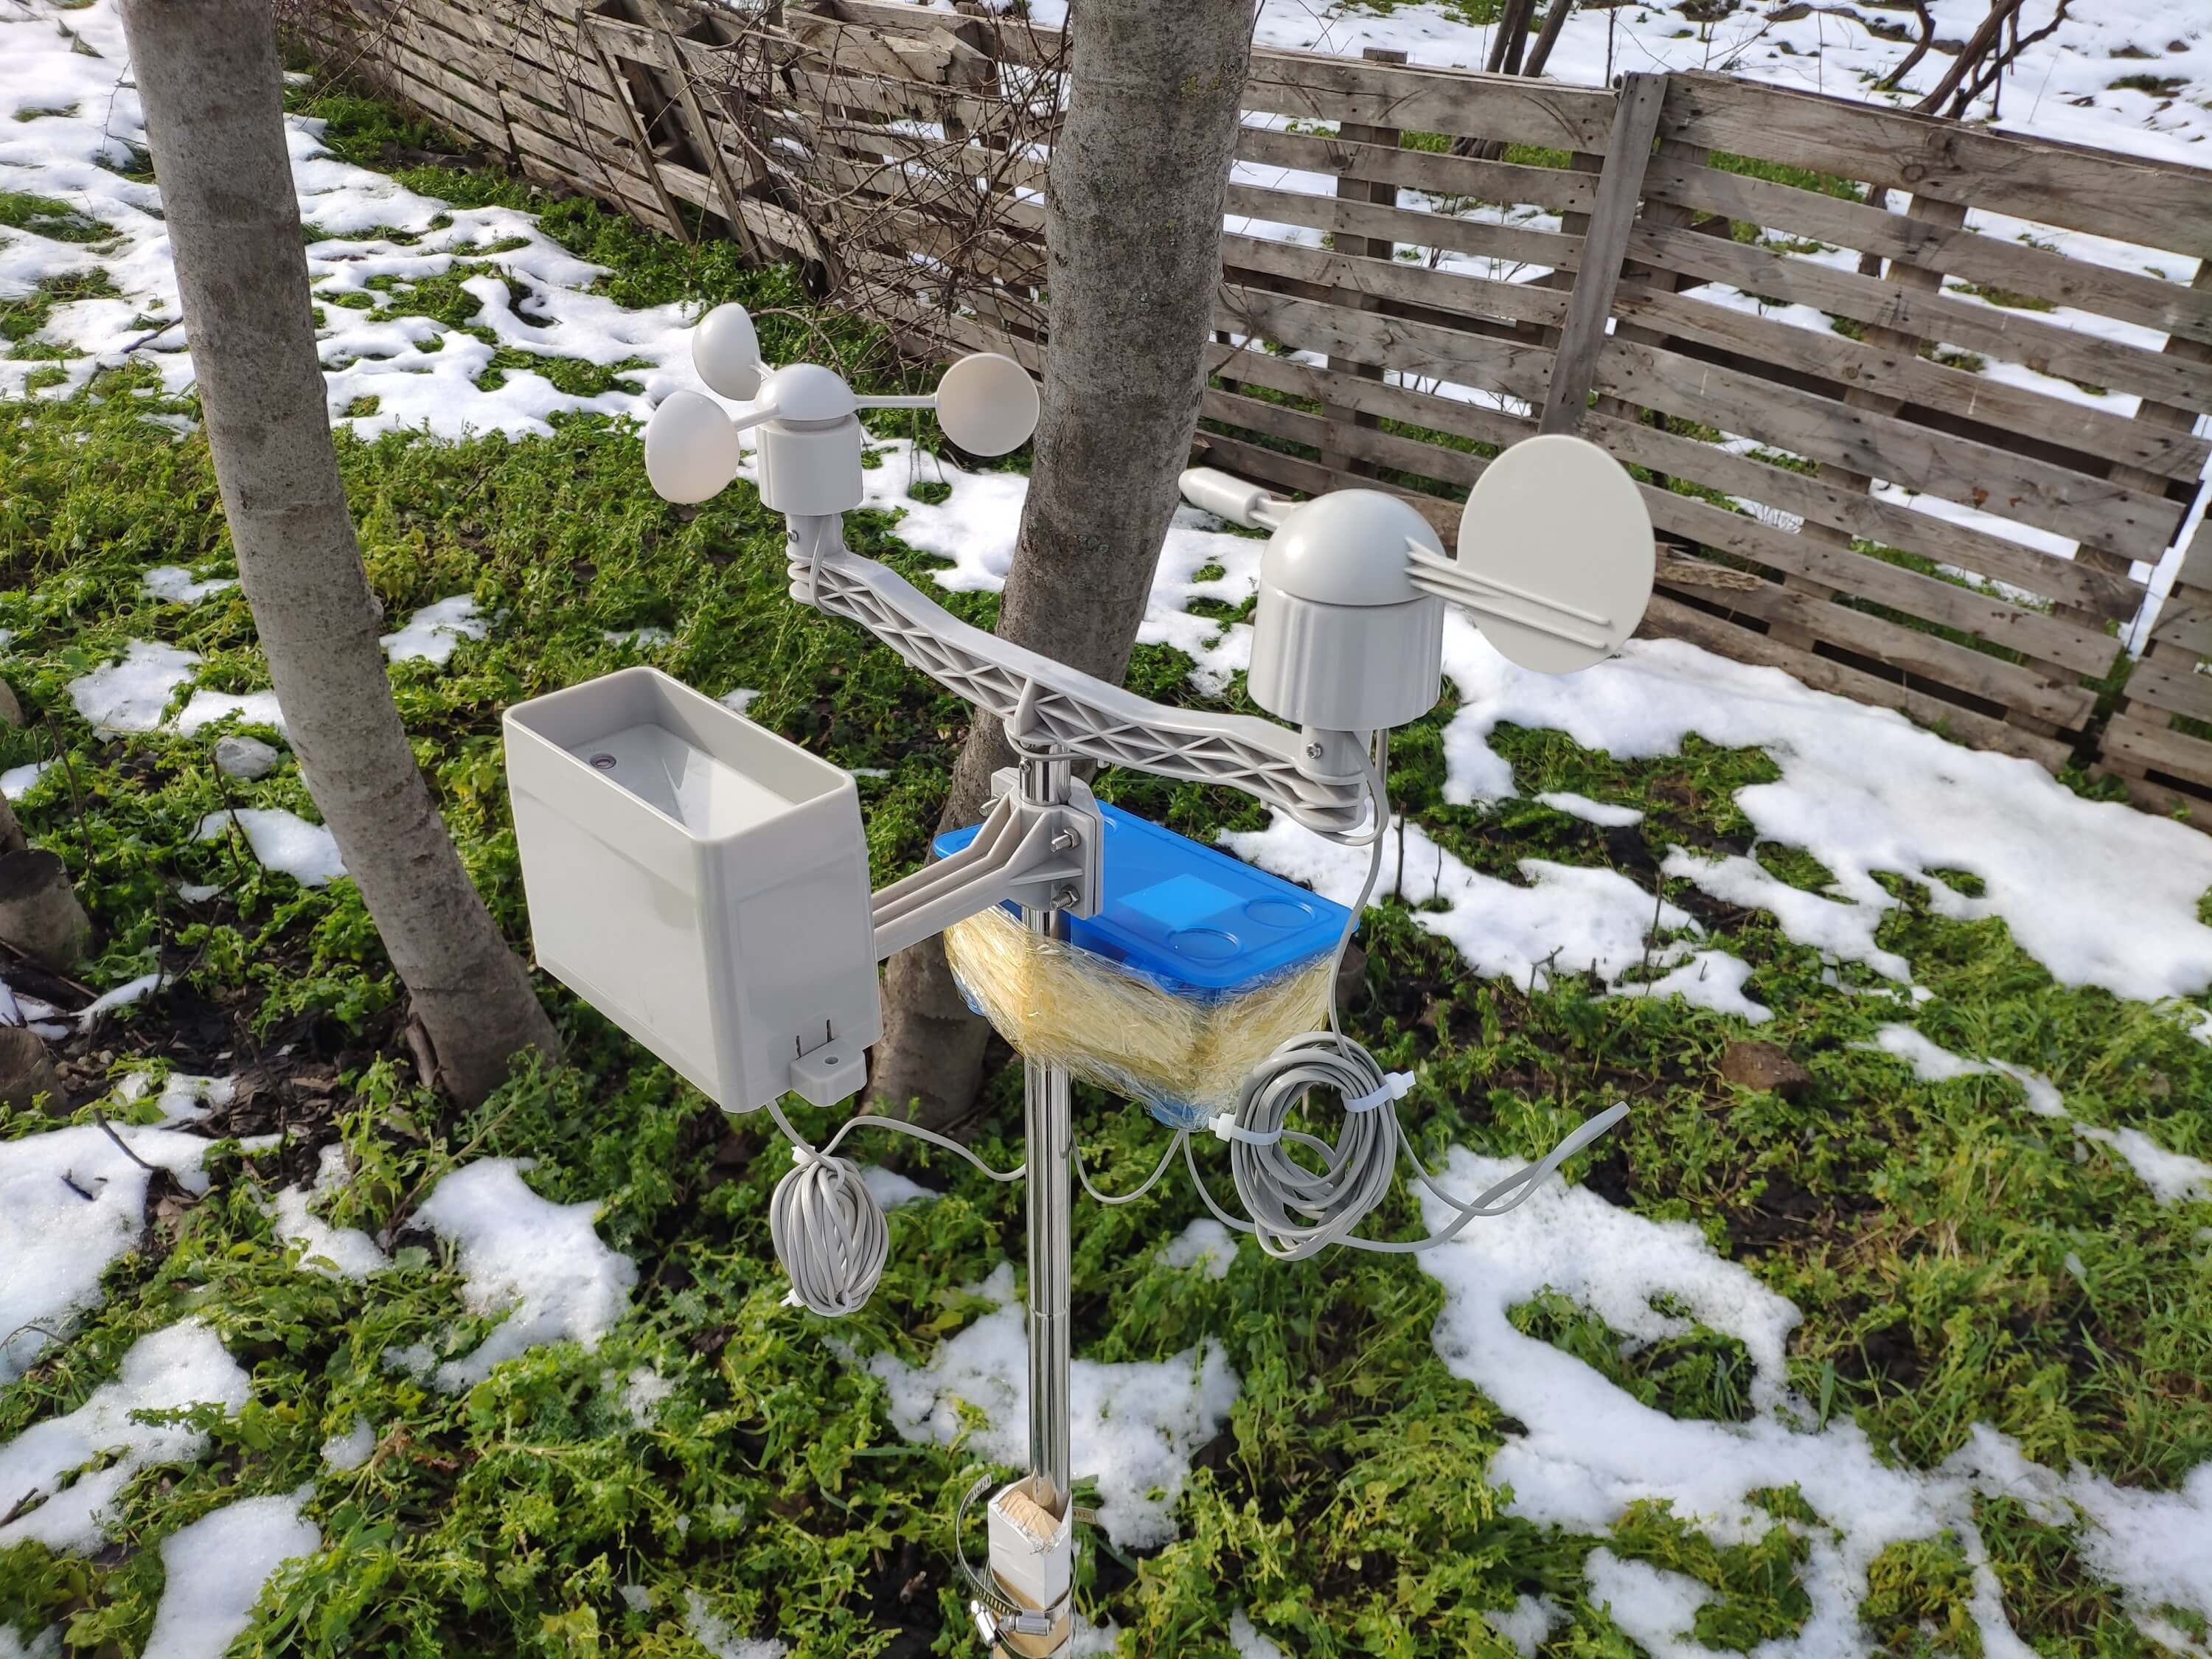
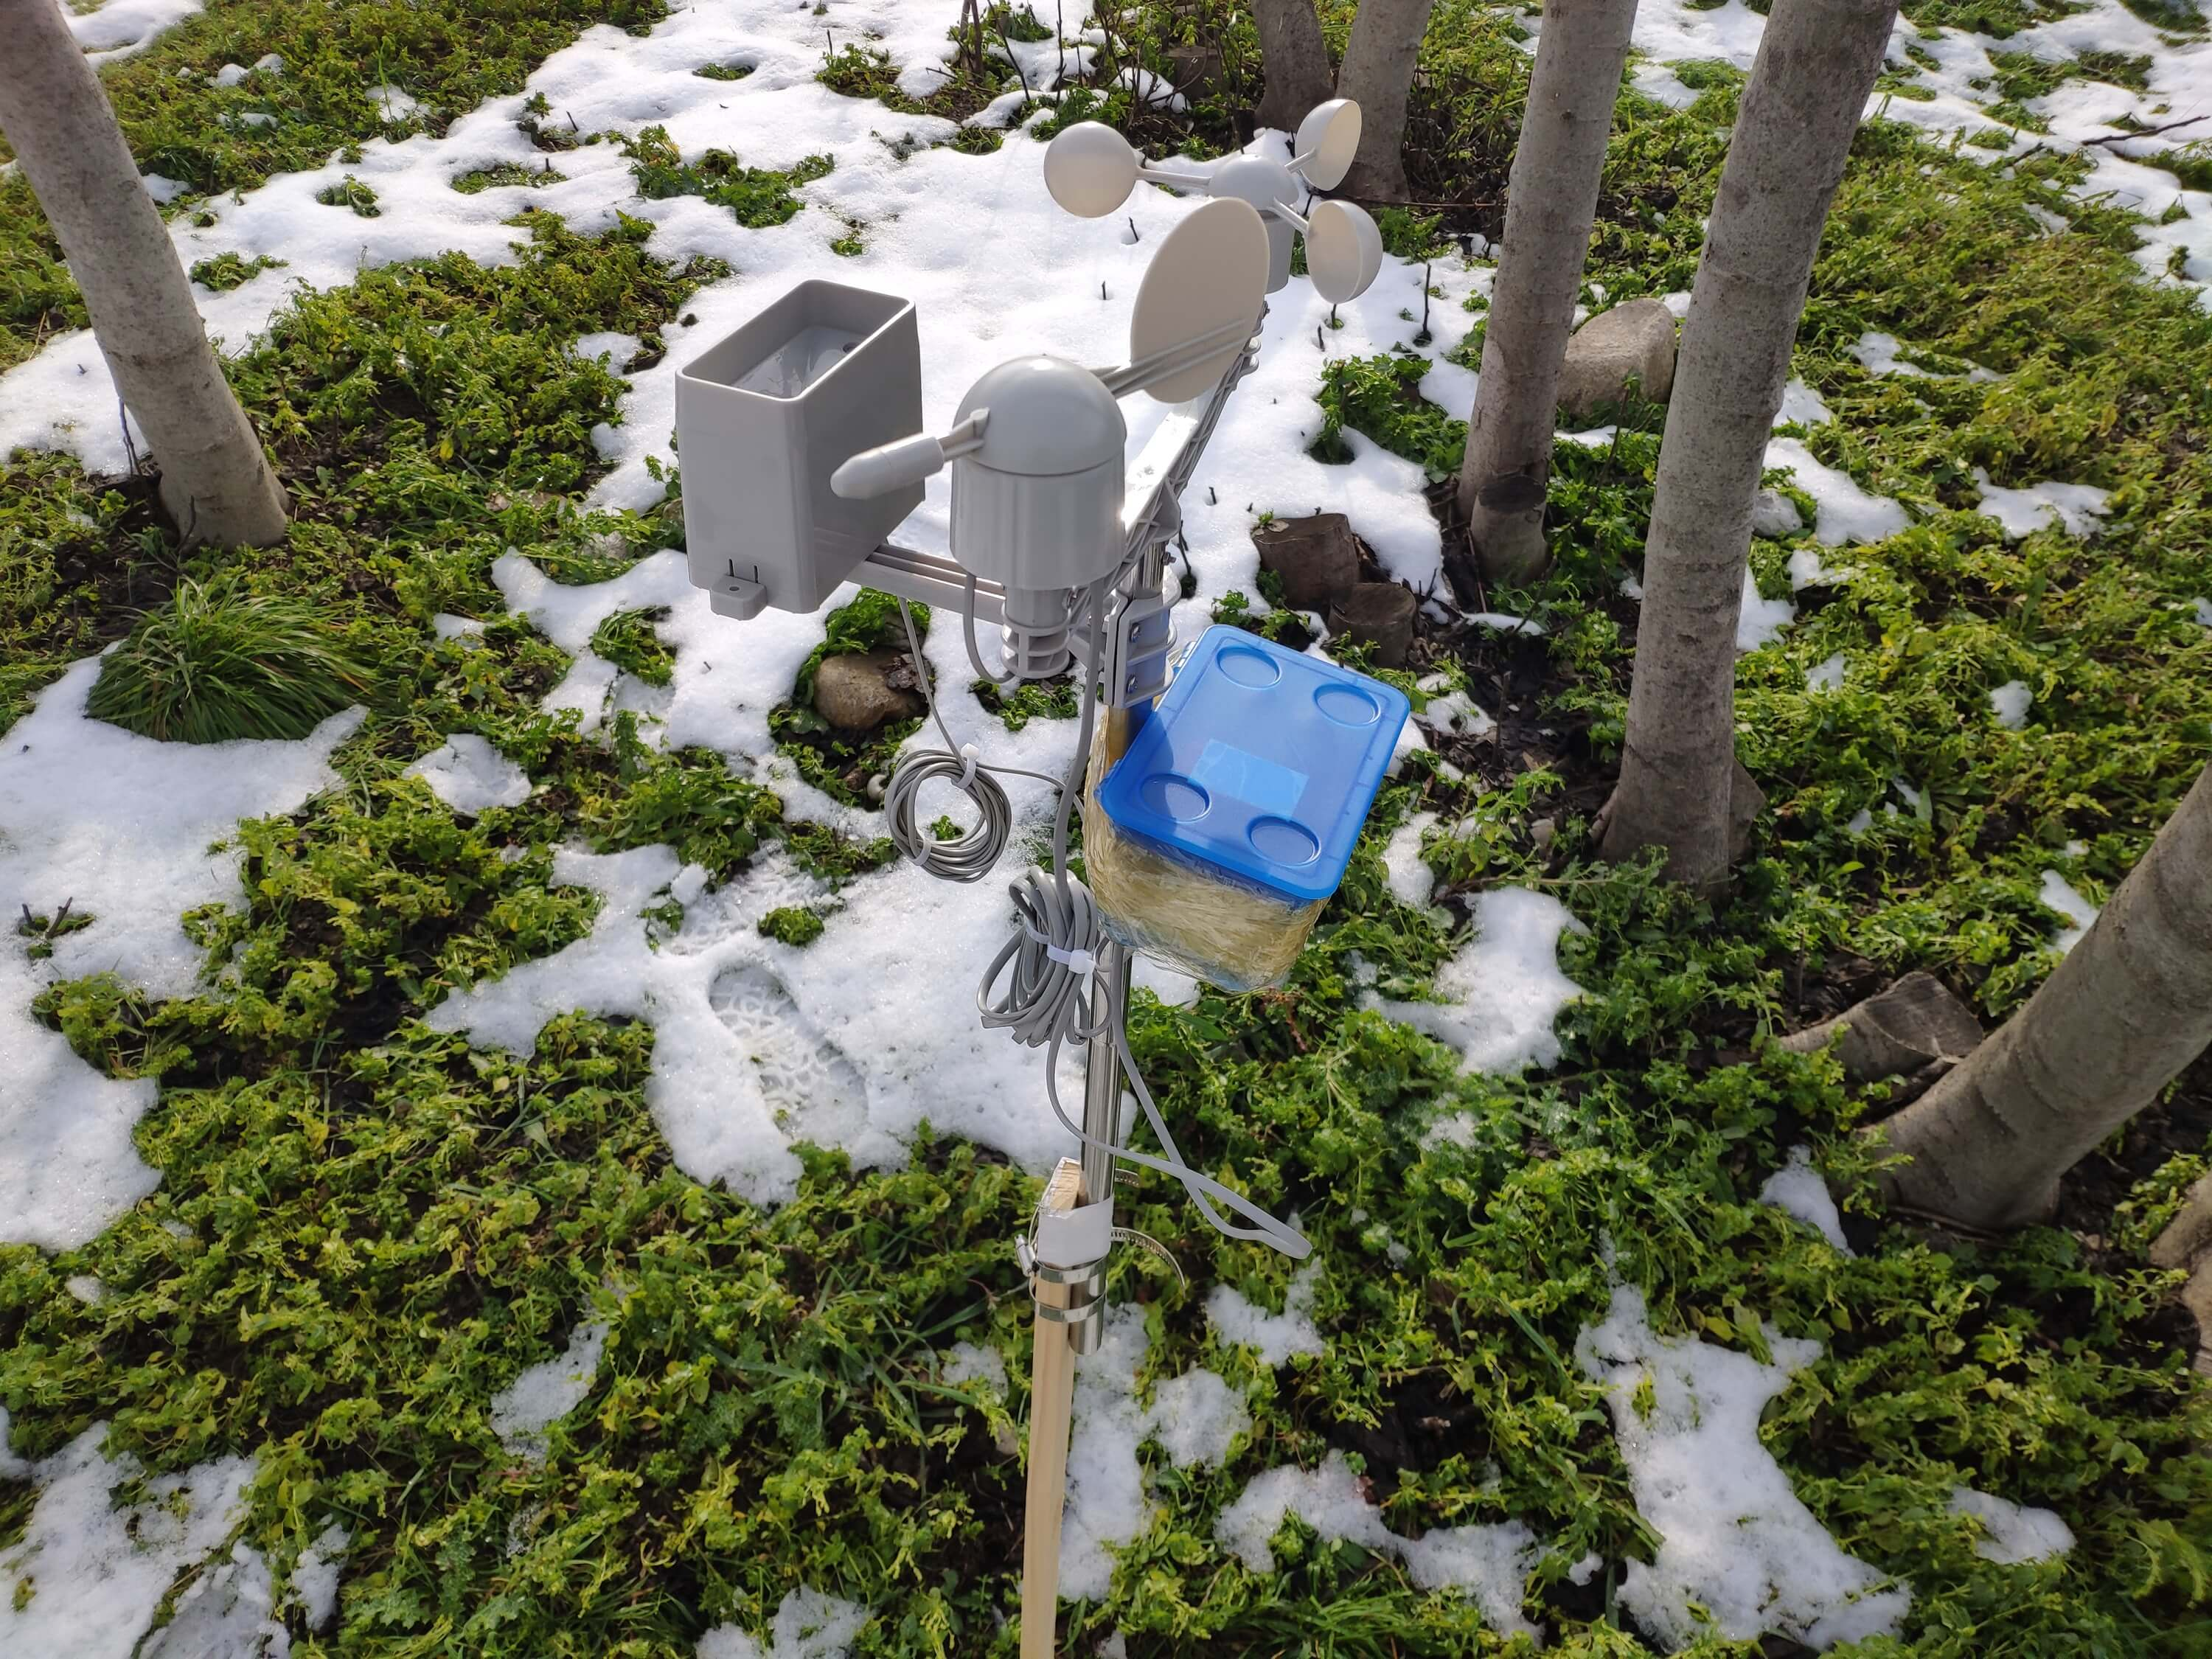
Paso 1:ensamblar el equipo de la estación meteorológica con un anemómetro, una veleta y un balde de lluvia
Este kit de estación meteorológica incluye un anemómetro, una enredadera de viento, un cubo de lluvia y una placa de sensor para enviar datos meteorológicos a través del protocolo de comunicación en serie. Por lo tanto, es fácil de usar con placas de desarrollo para recopilar datos meteorológicos locales.
Produce 37 bytes por segundo, incluido el final CR / LF .
c000s000g000t086r000p000h53b10020 Analizador de datos:
- c000 : Dirección del aire, grado
- s000 : Velocidad del aire (promedio), 0,1 millas por hora
- g000 : Velocidad del aire (máx.), 0,1 millas por hora
- t086 : Temperatura, Fahrenheit
- r000 : Lluvia (1 hora), 0,01 pulgadas
- p000 : Lluvia (24 horas), 0,01 pulgadas
- h53 : Humedad,% (00 % =100)
- b10020 : Atmósfera, 0,1 hPa
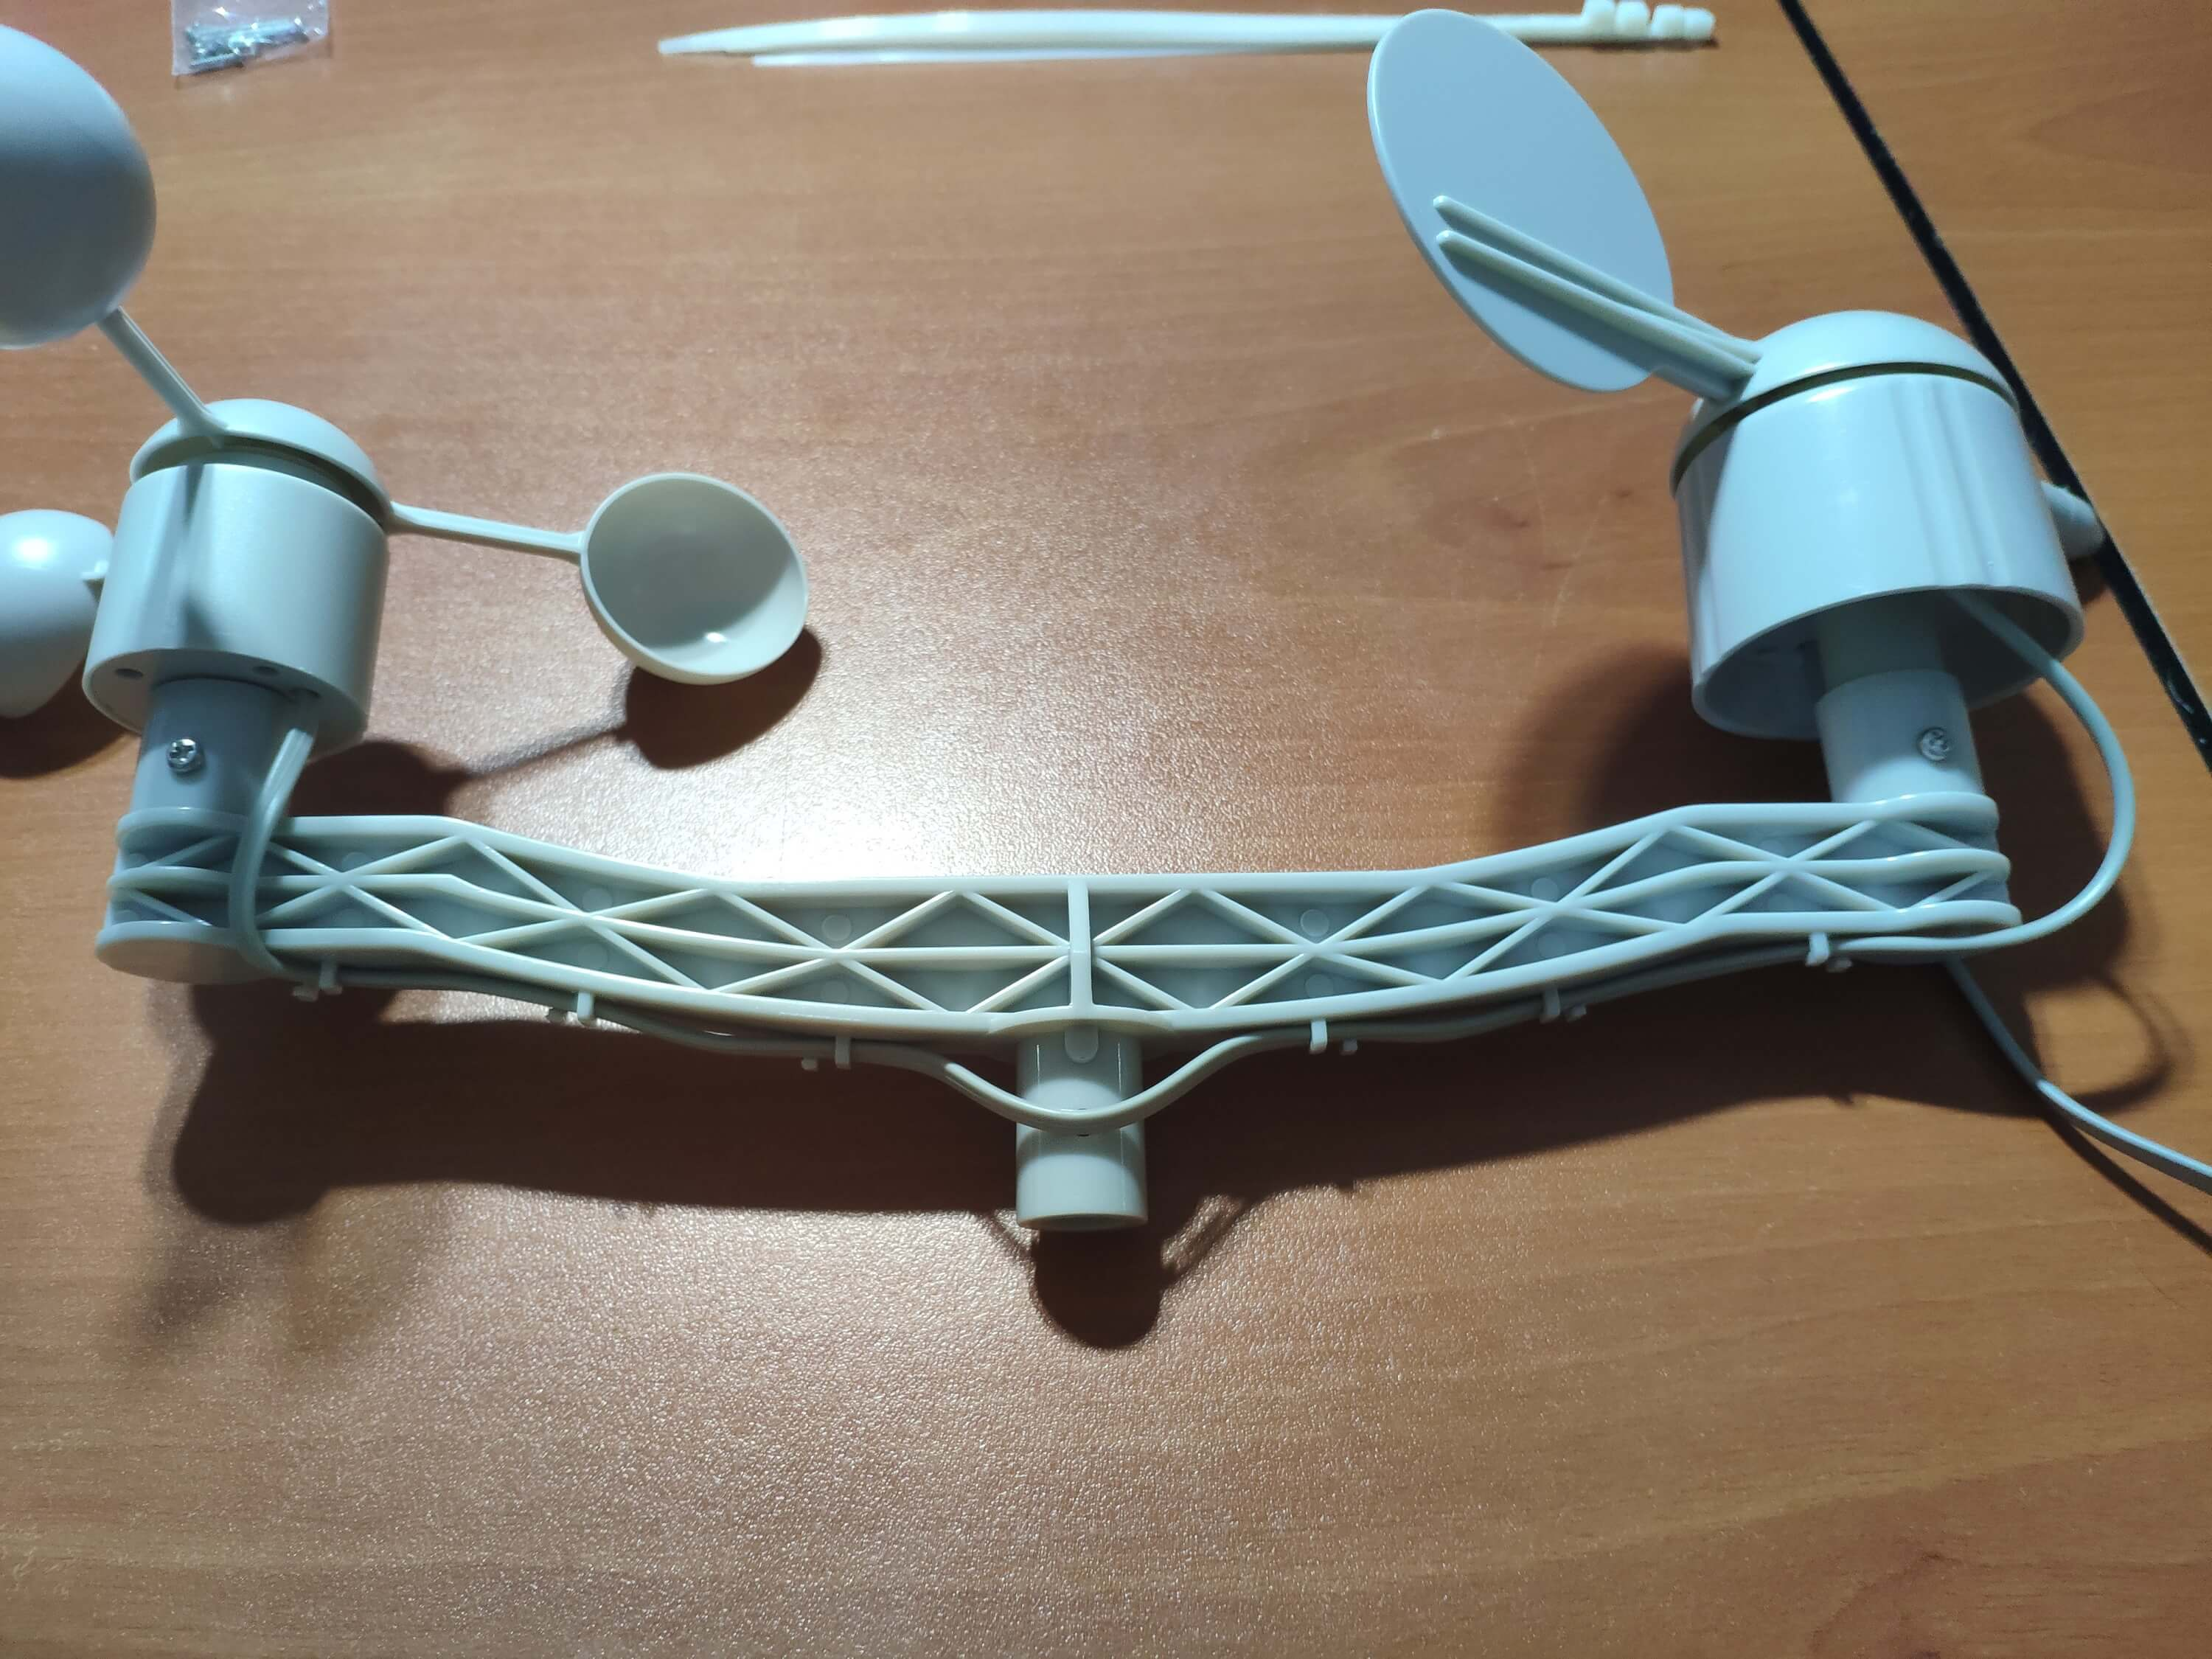
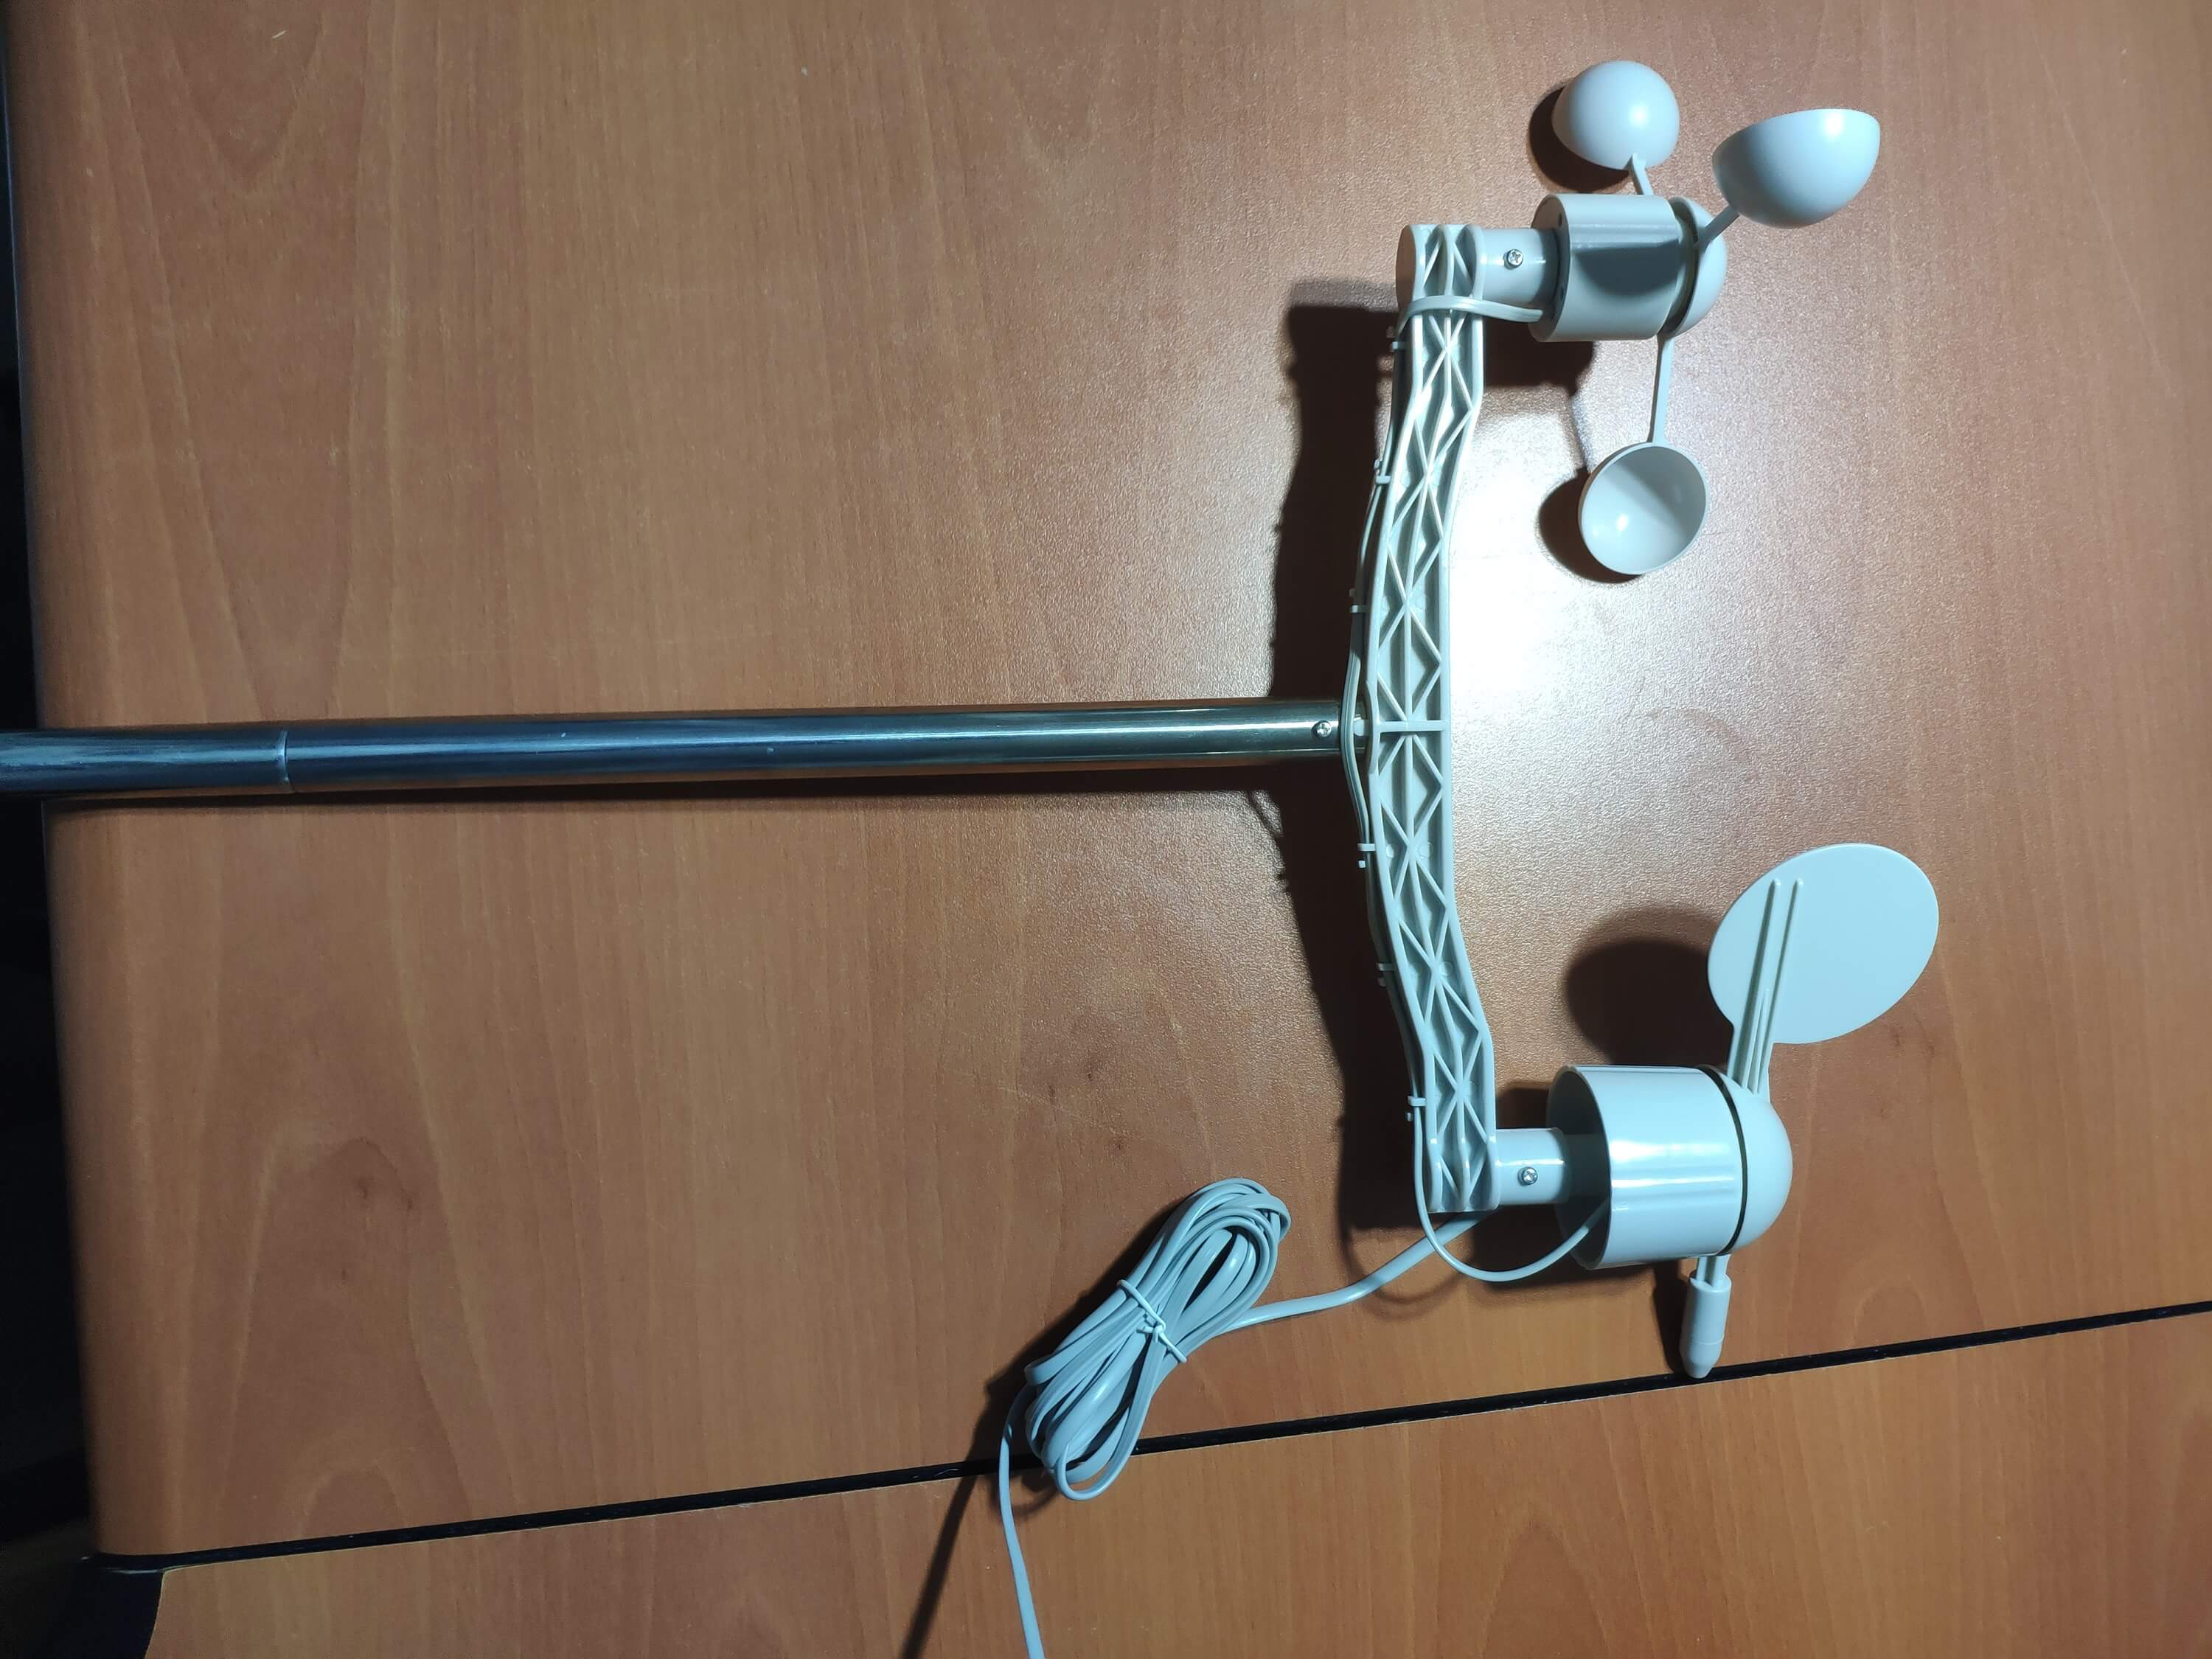
⭐ En primer lugar, fije el anemómetro y la veleta al puente con tornillos y tuercas.
⭐ Conecte la veleta al anemómetro usando el cable telefónico RJ11 y apriételo debajo del puente.
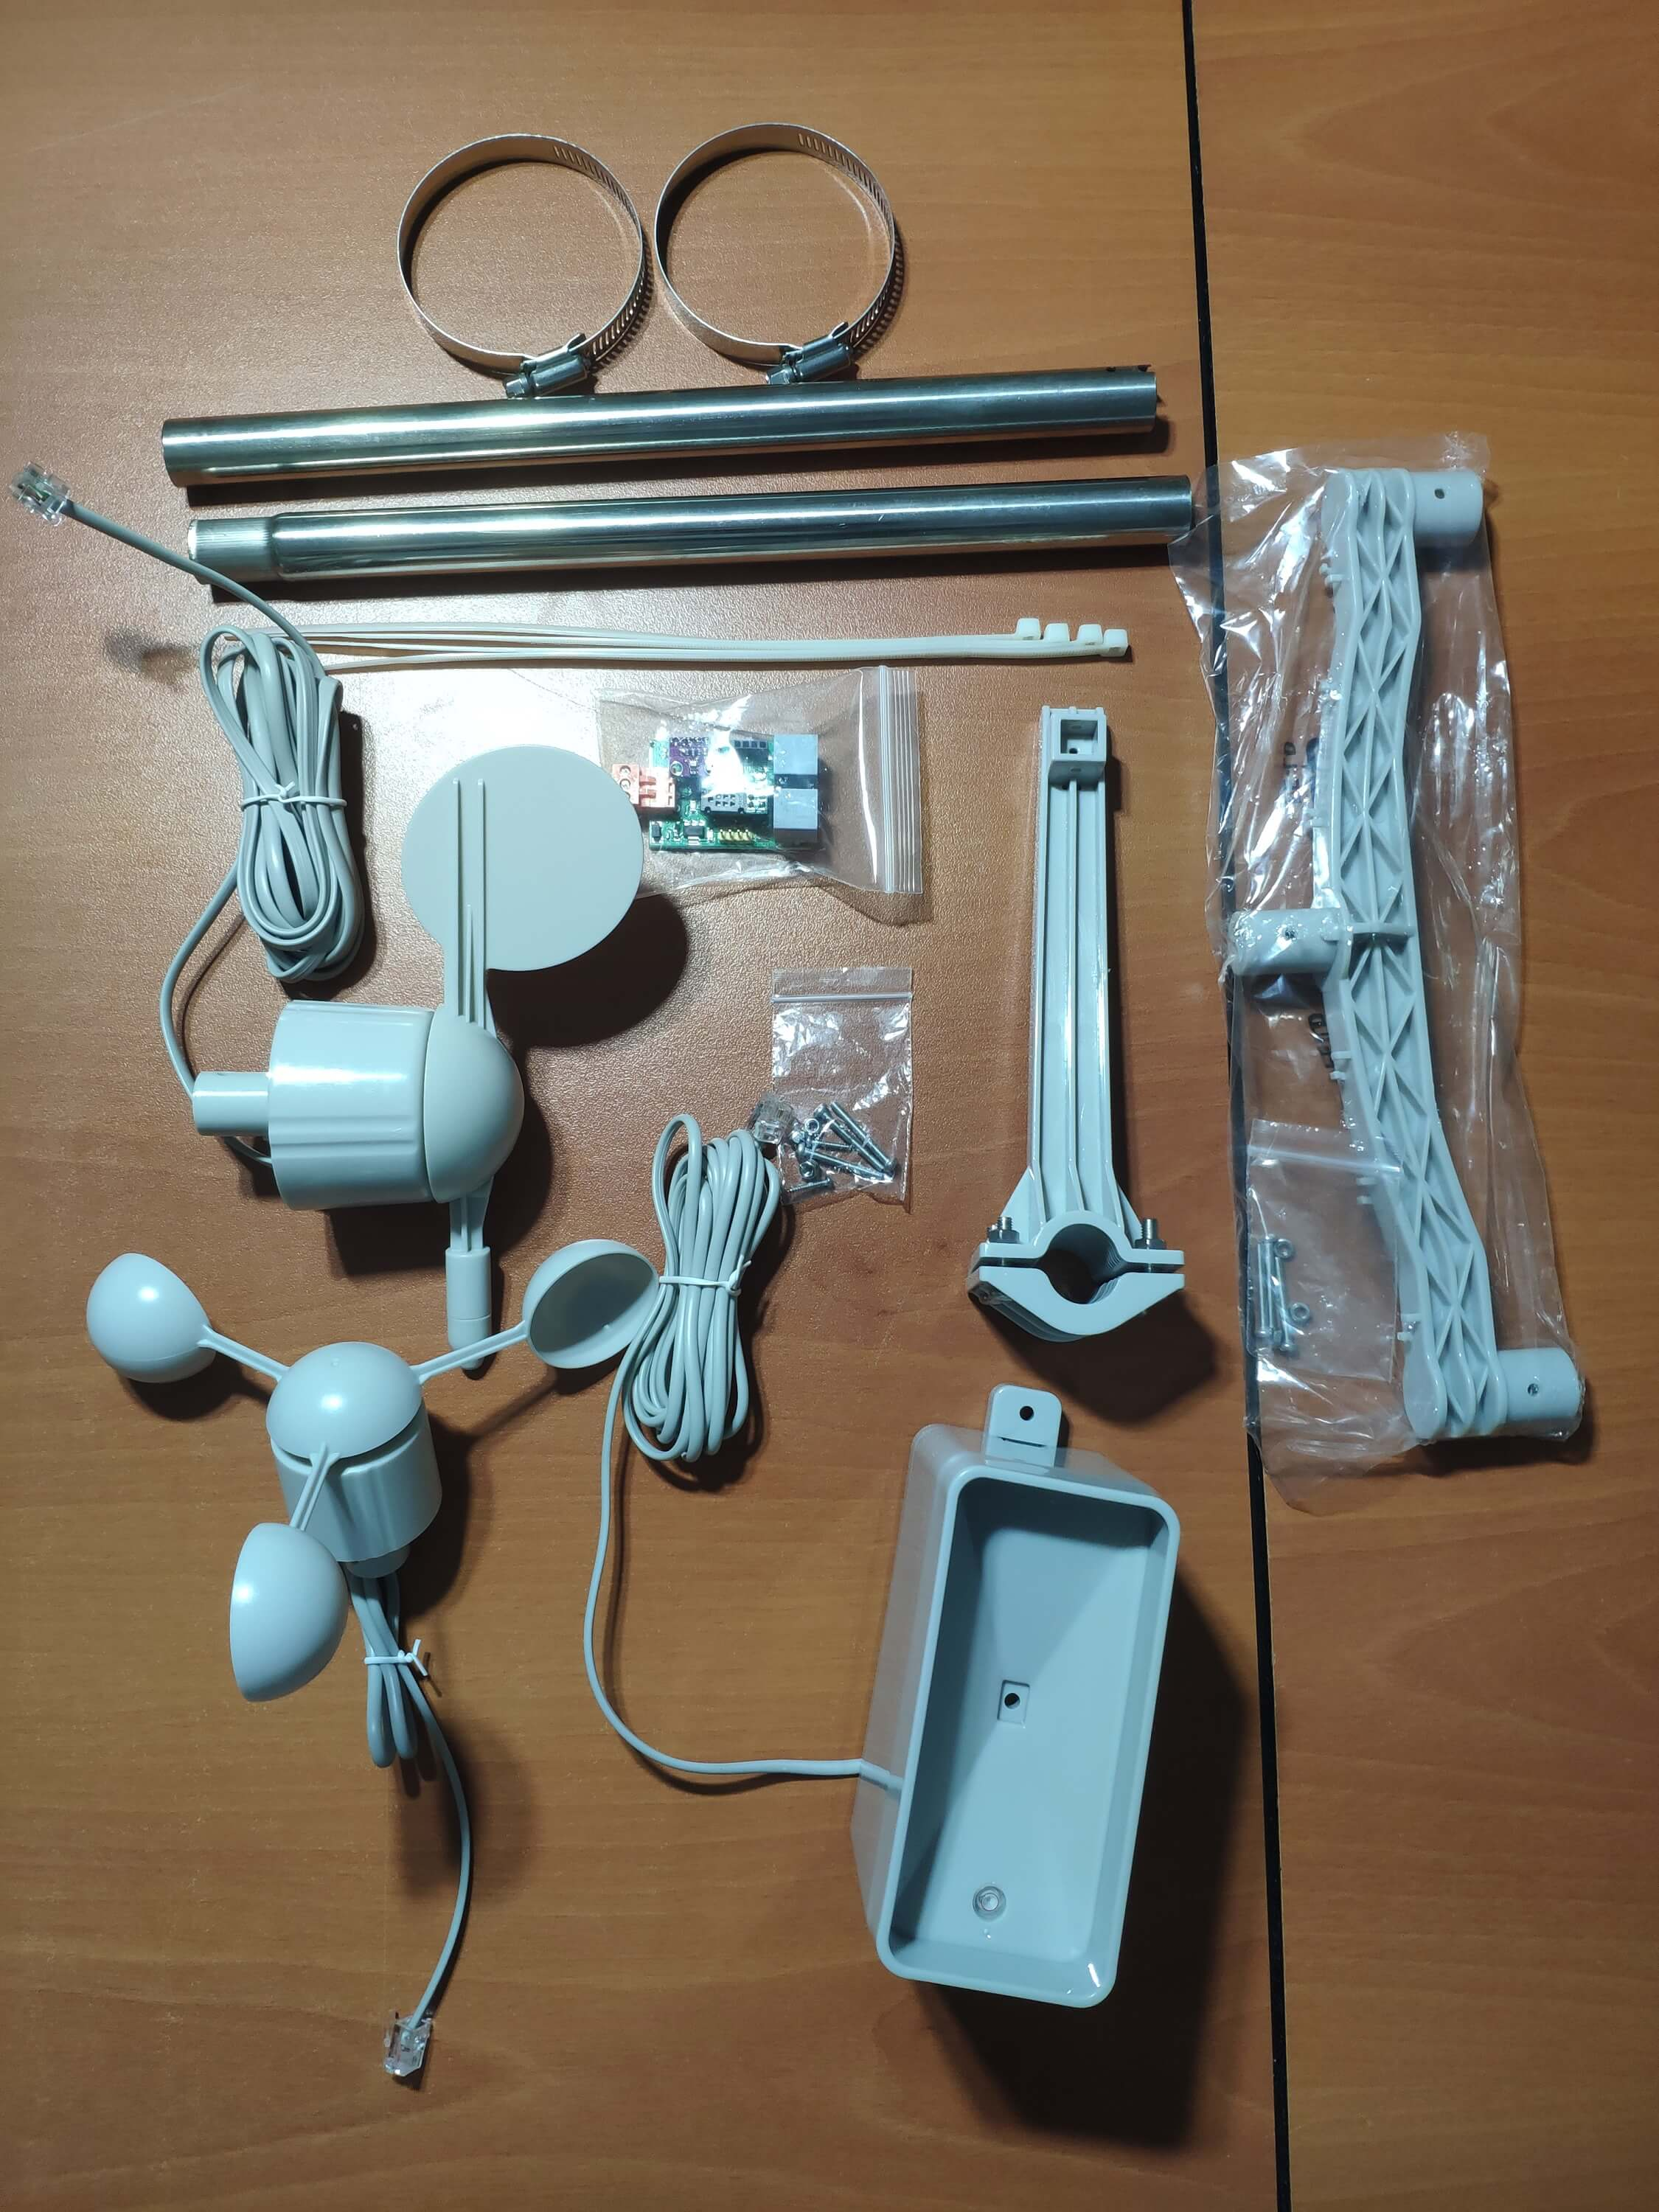
⭐ Luego, monte la varilla de acero inoxidable en el puente con tornillos.
⭐ Instale la junta del cubo de lluvia debajo del cubo de lluvia con tornillos.
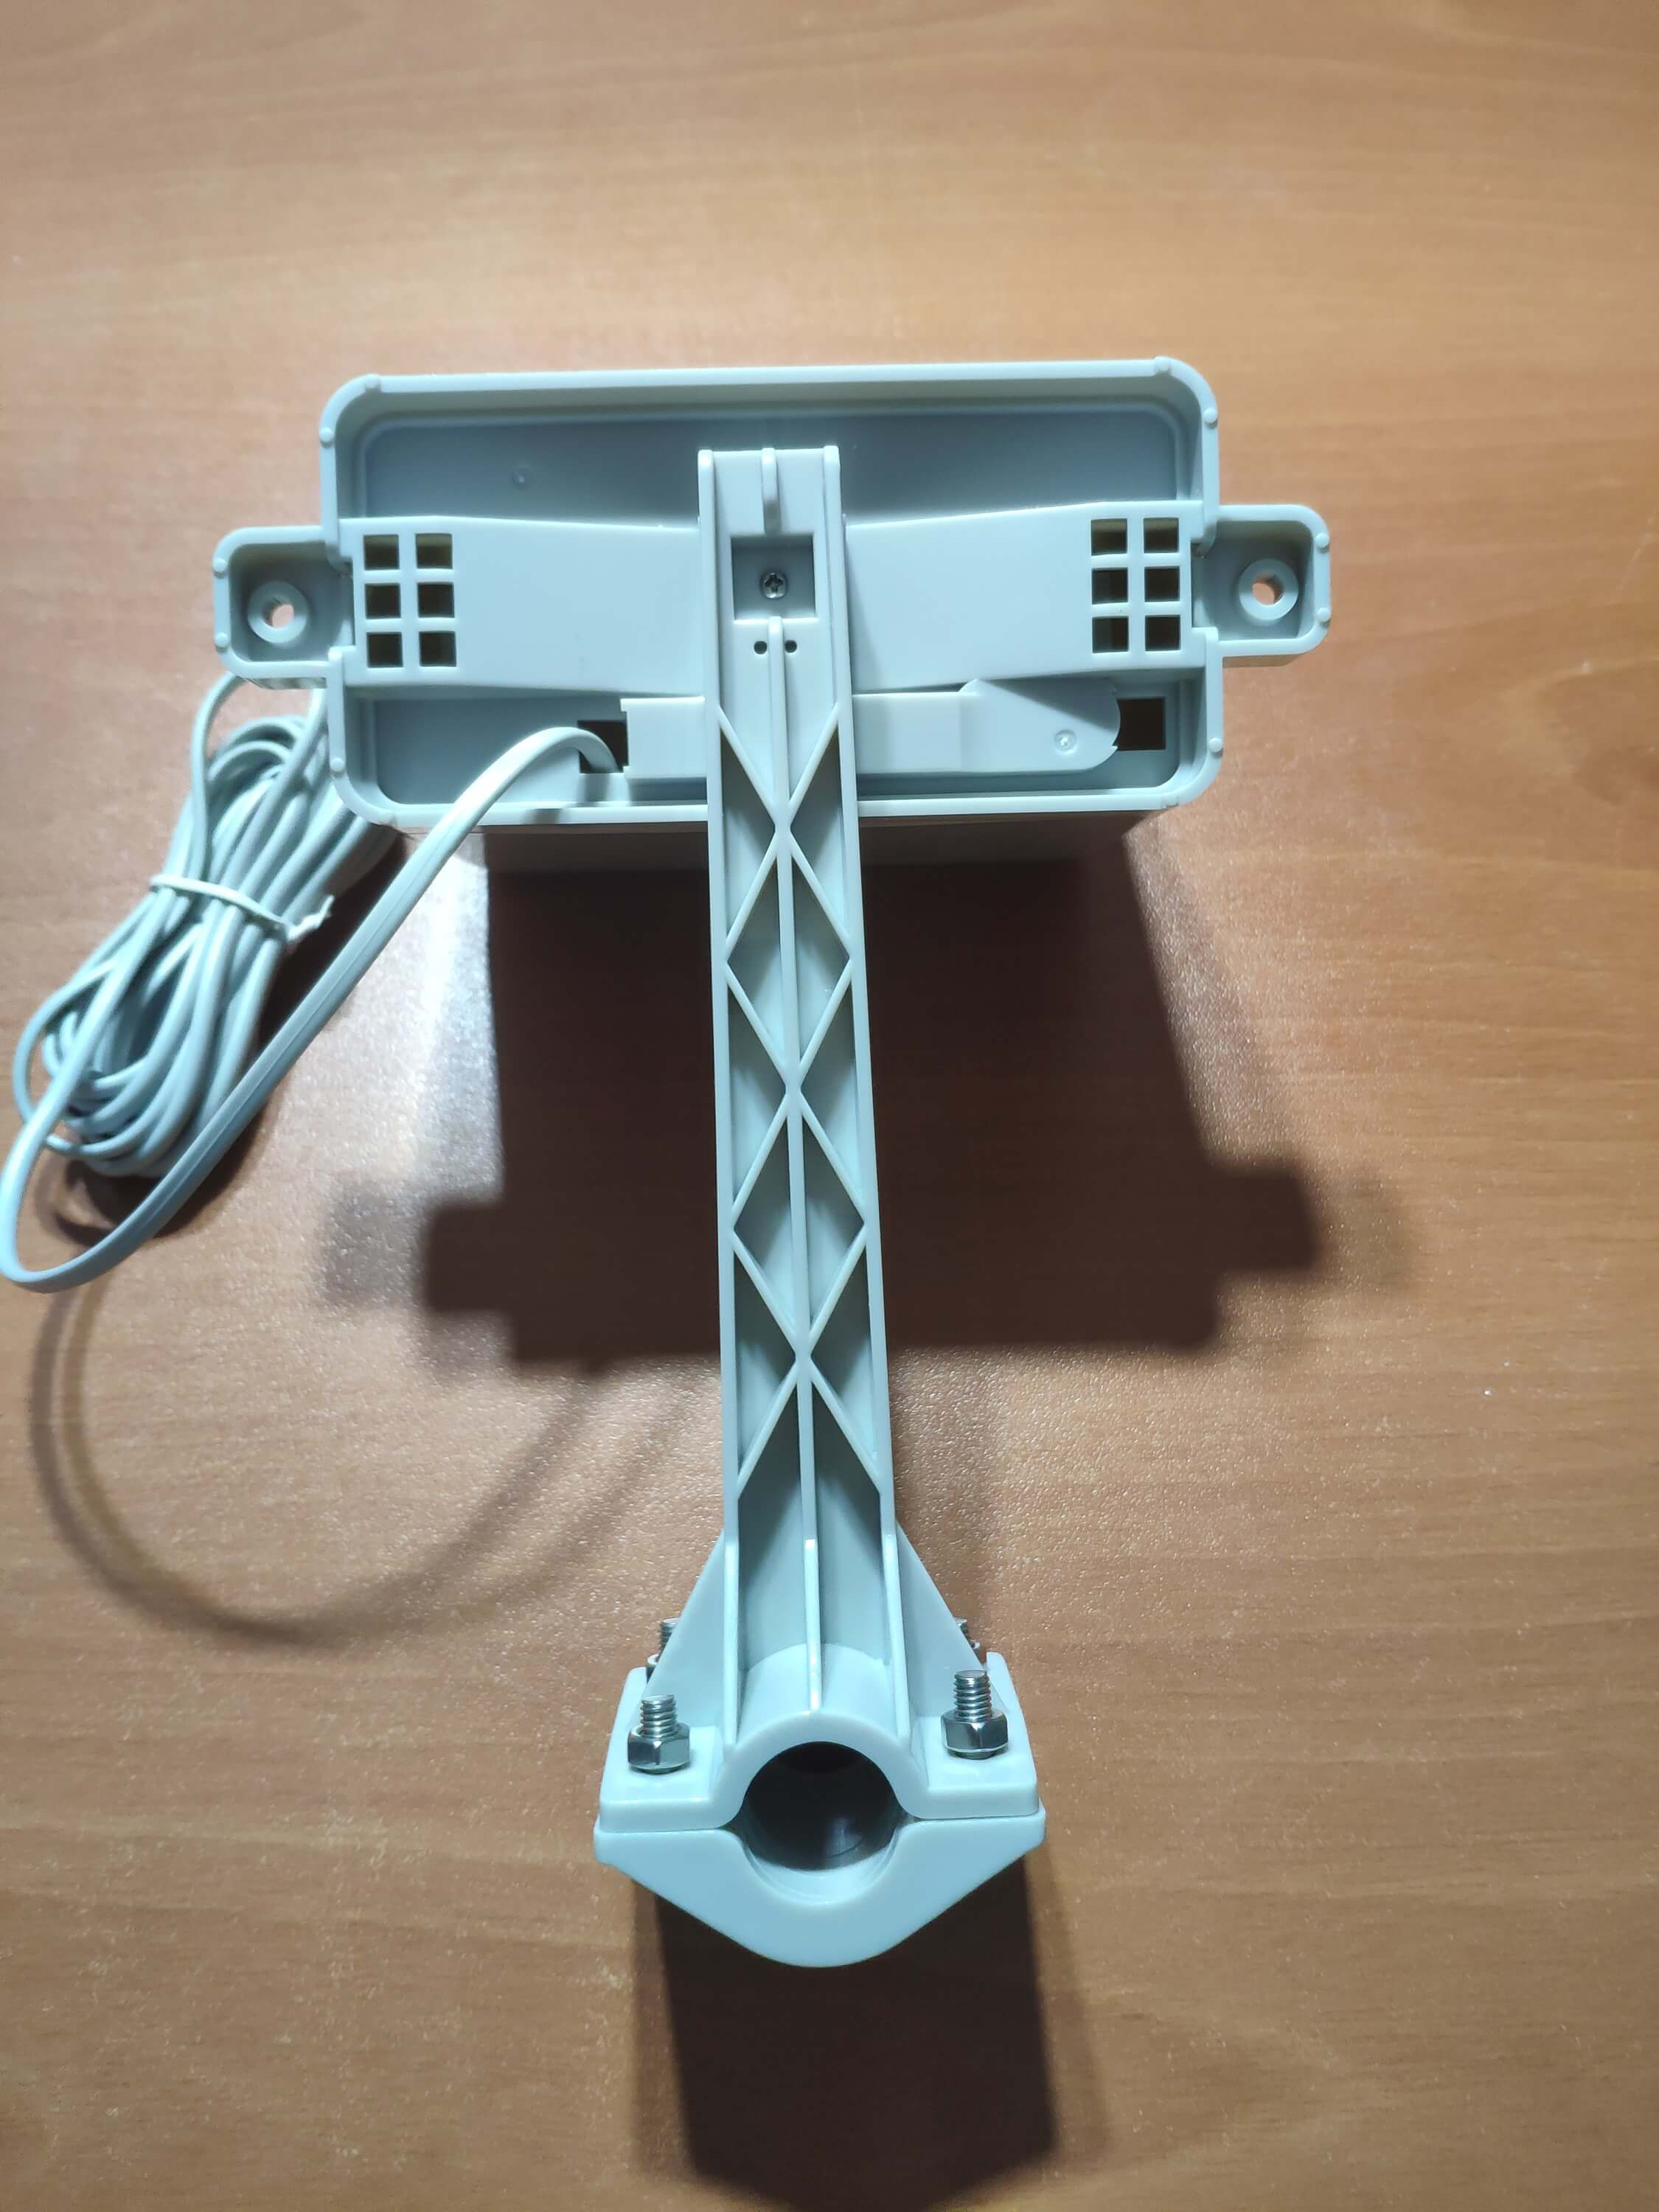
⭐ Por último, coloque el balde de lluvia sobre el palo de acero inoxidable utilizando tornillos y tuercas.
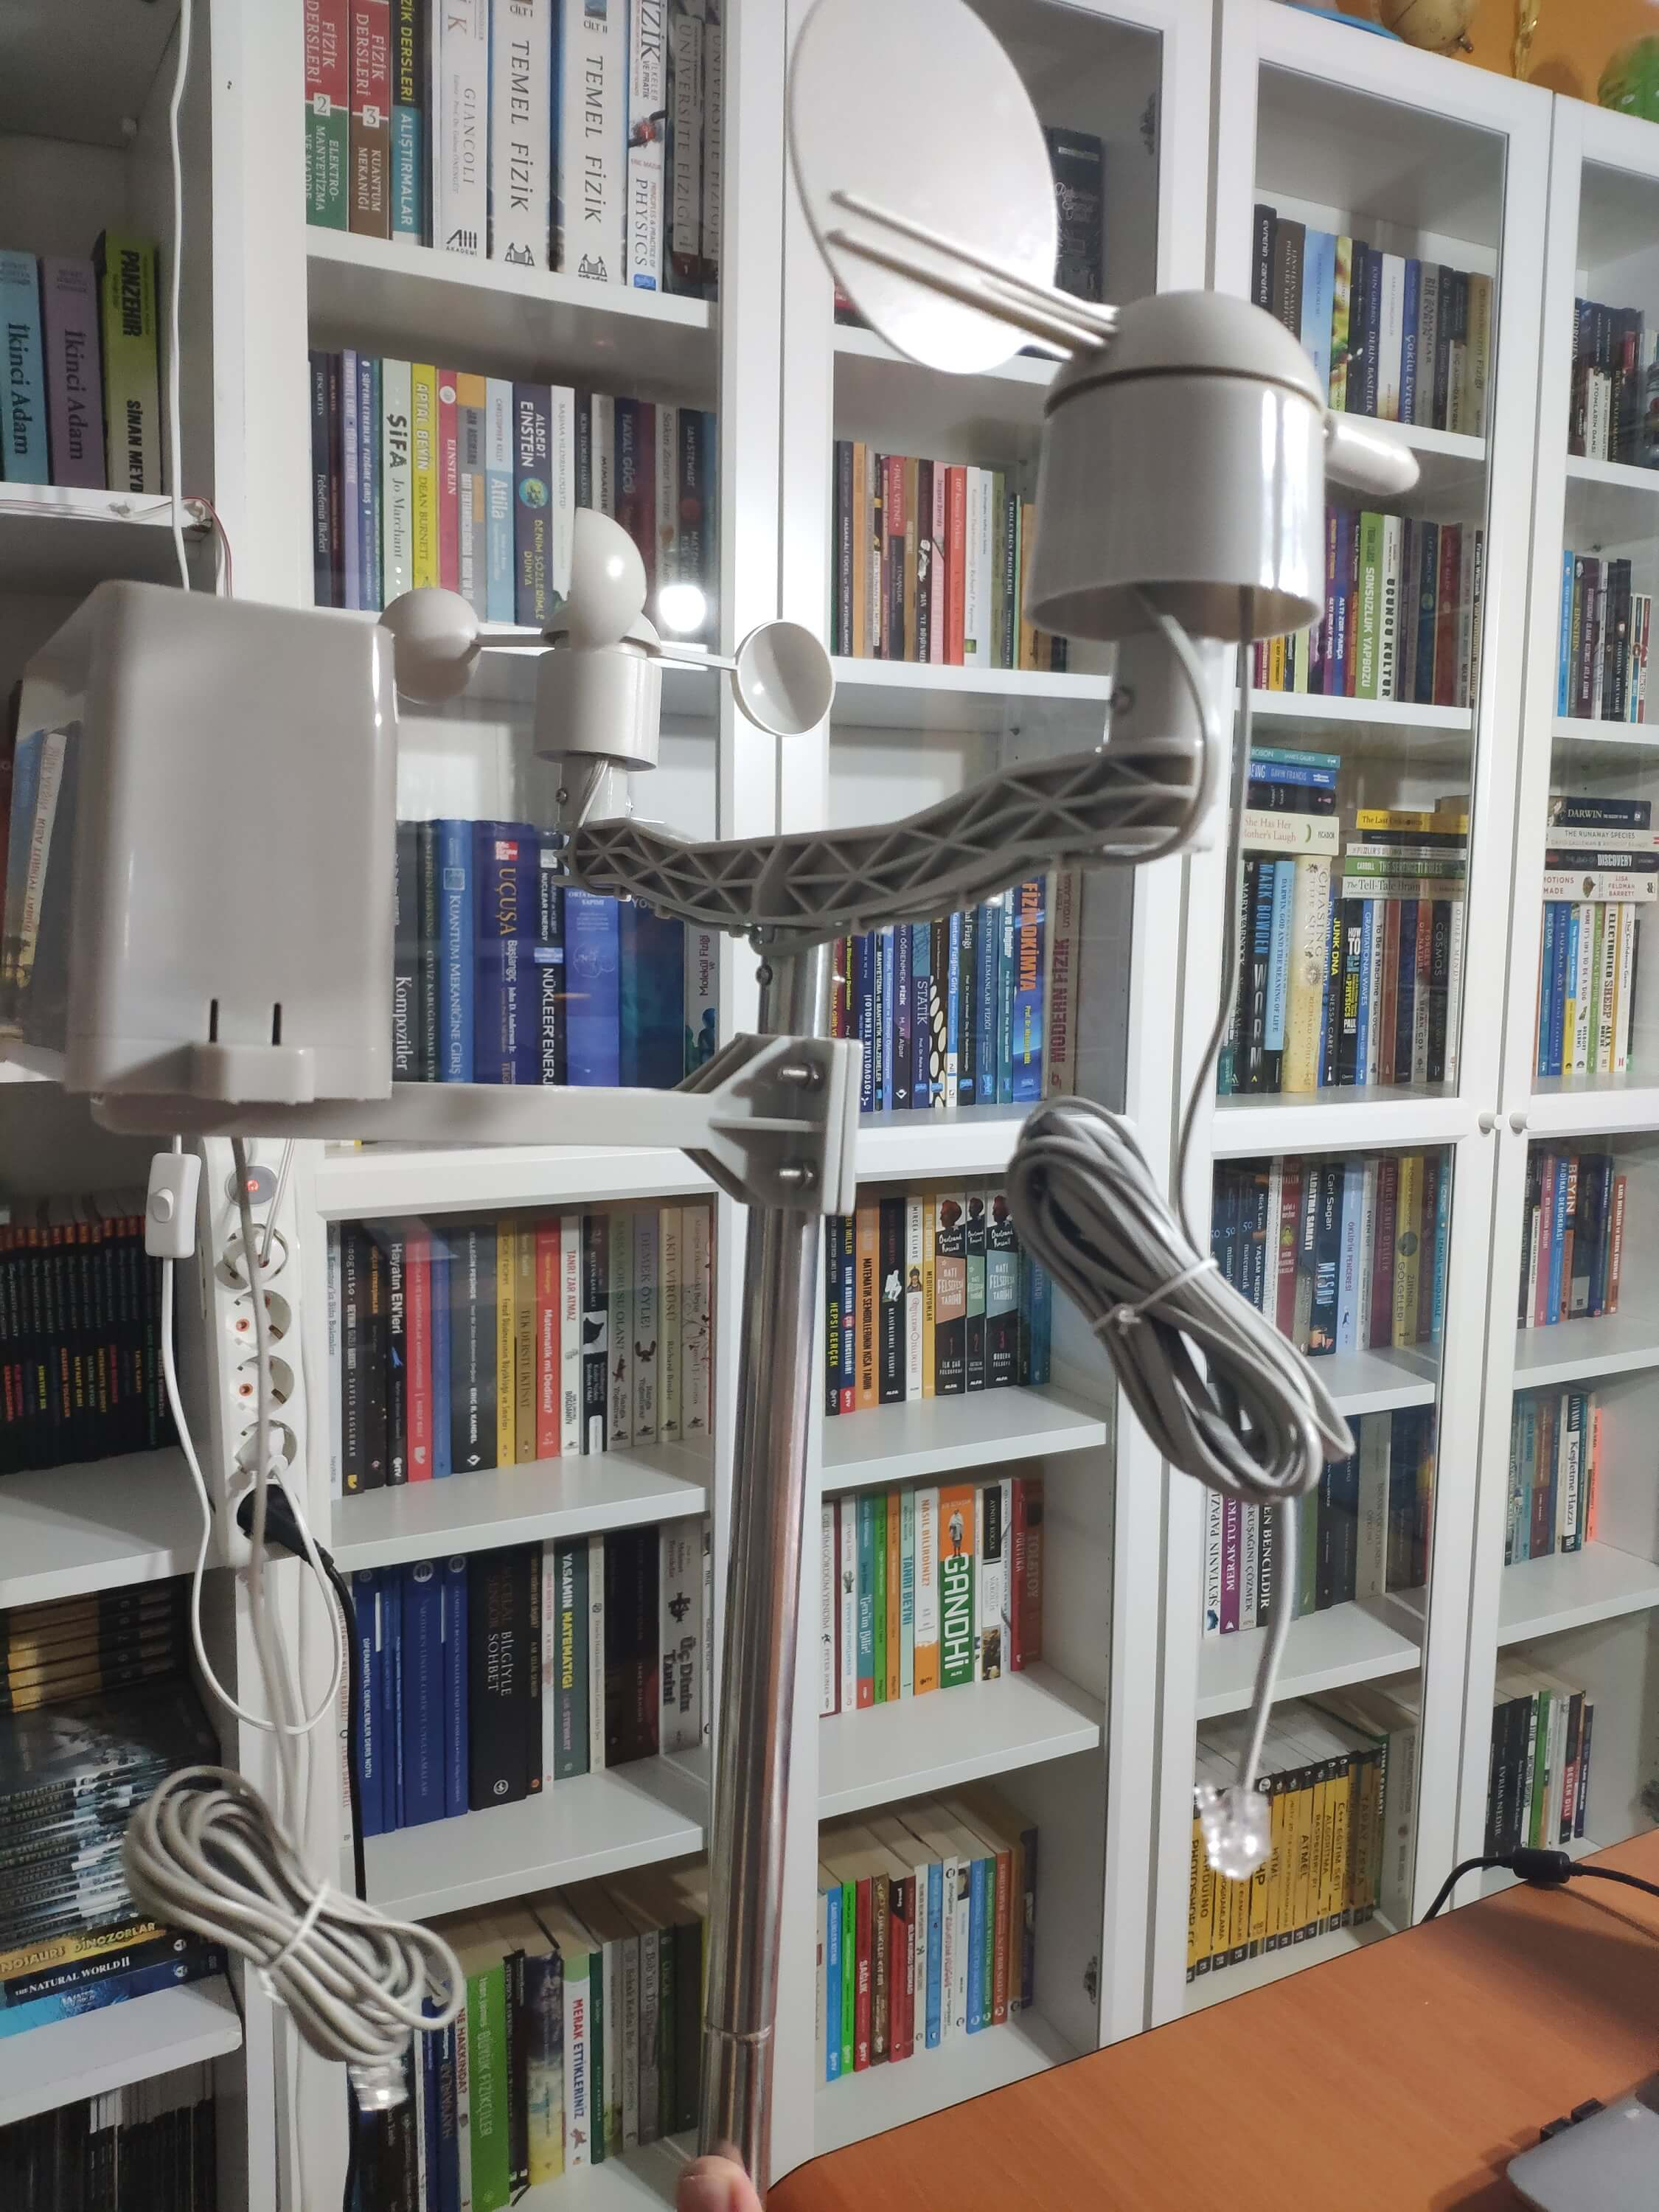
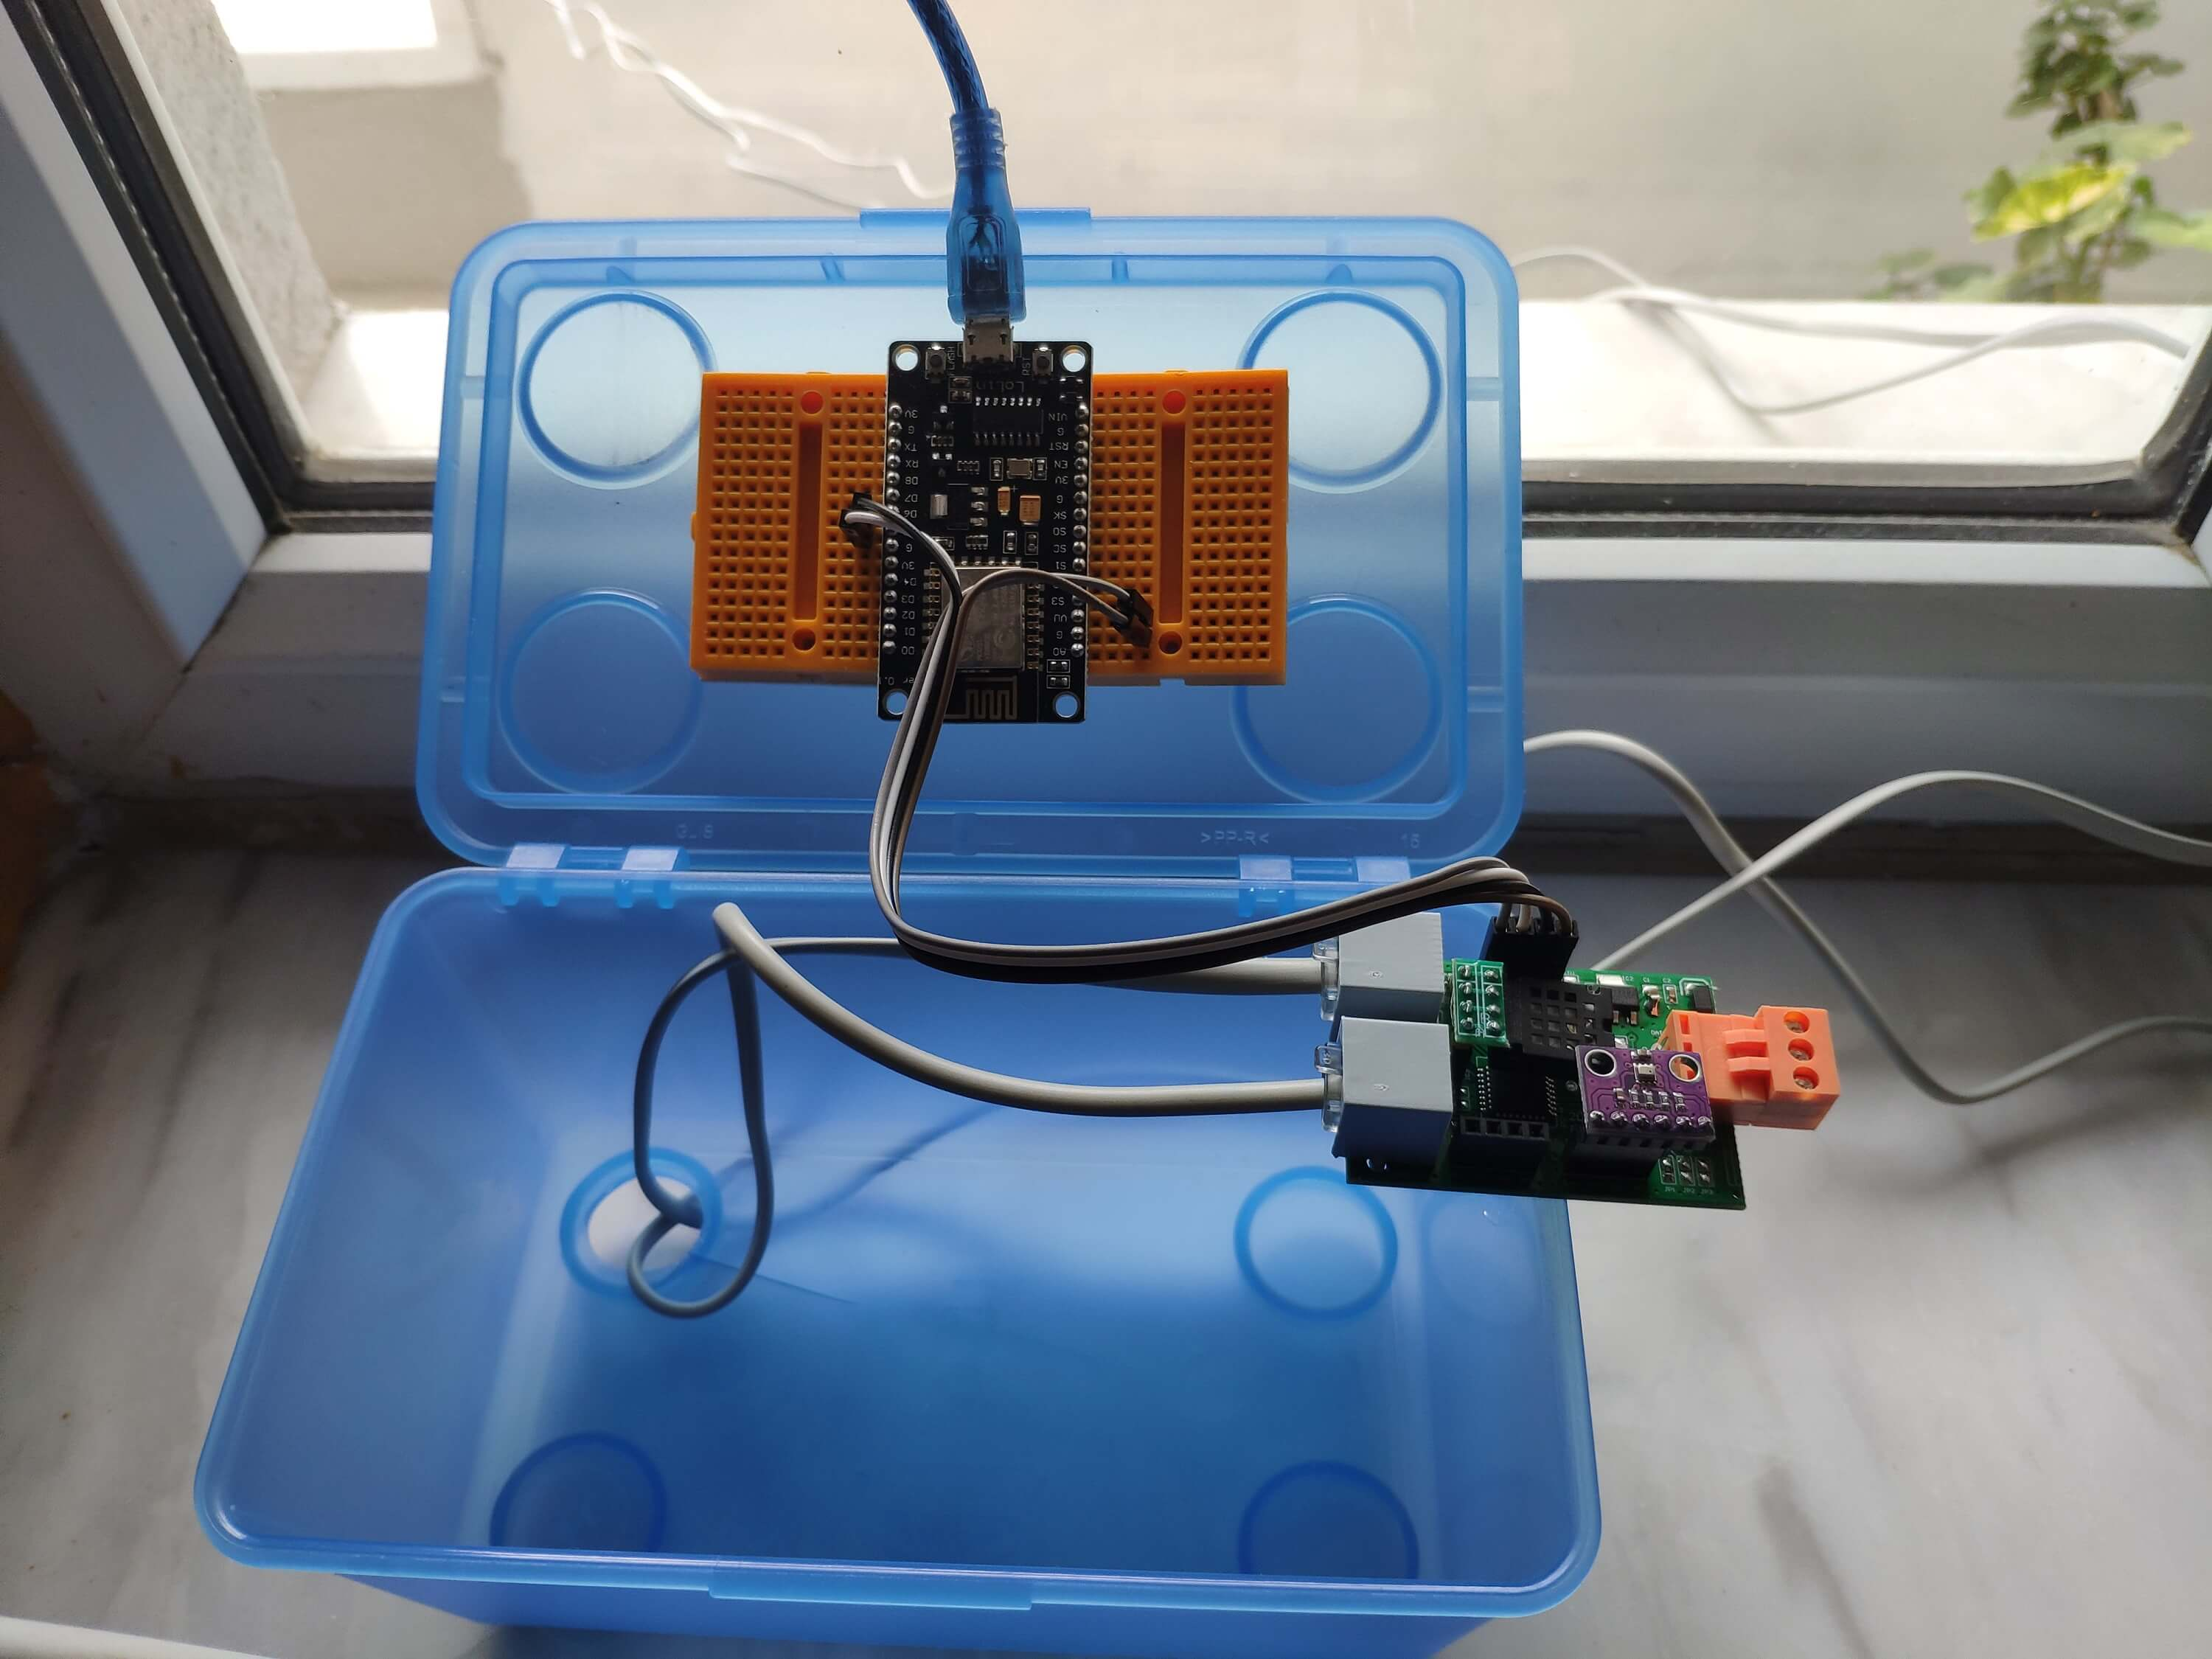
⭐ Ahora, está listo para recopilar datos meteorológicos incluso en condiciones meteorológicas extremas. Sin embargo, la placa del sensor (convertidor) no es resistente a la intemperie, así que agregué una caja de plástico a la estación meteorológica para proteger la placa del sensor y el escudo SIM808 en exteriores.
Paso 2:recopilación de datos meteorológicos en Google Sheets
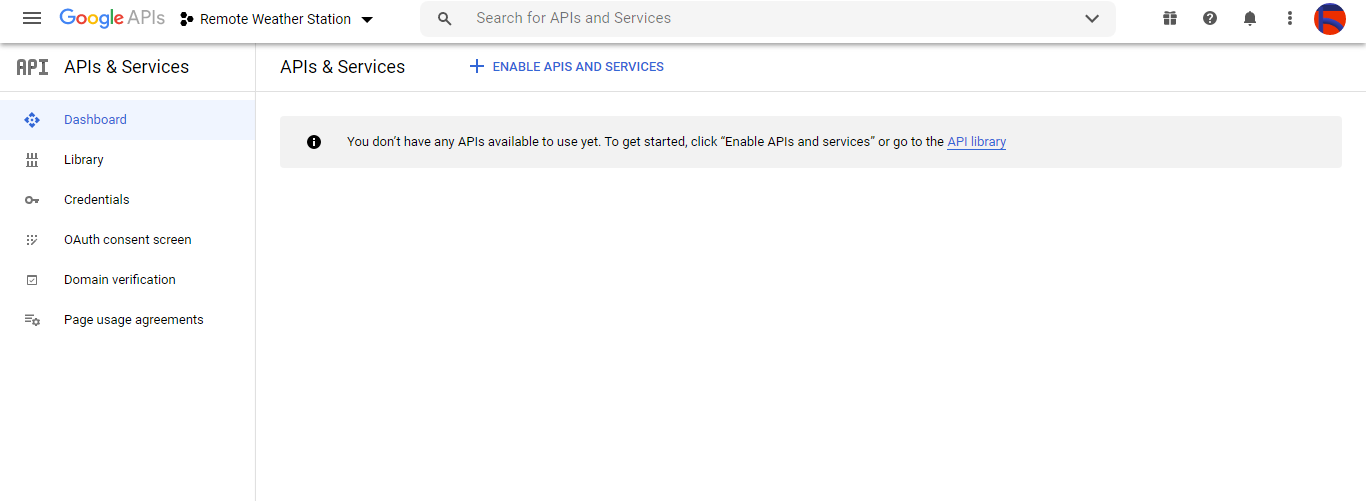
Para poder enviar información a una hoja de cálculo en Google Sheets, debe crear una nueva aplicación en Google Developer Console y obtener las credenciales de verificación para utilizar la API de Google Sheets. Si es un novato en la creación de aplicaciones con Google Developer Console, siga las instrucciones a continuación.
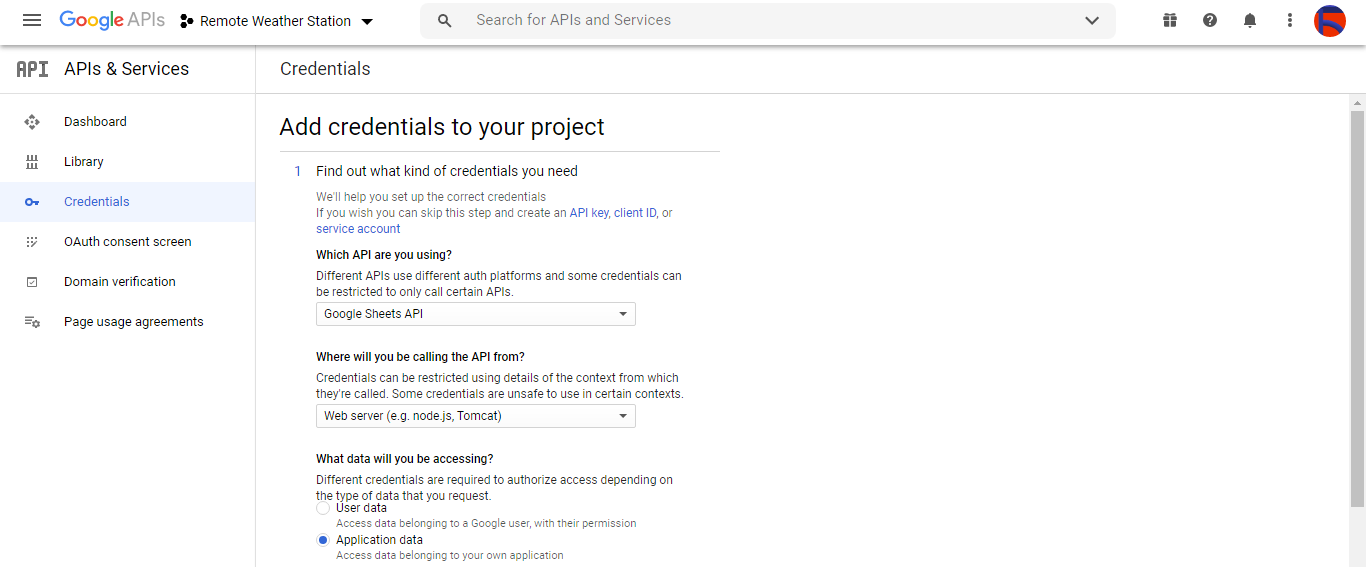
⭐ Vaya a Google Developer Console y haga clic en el botón 'NUEVO PROYECTO'. Ingrese el nombre del proyecto como Estación meteorológica remota .

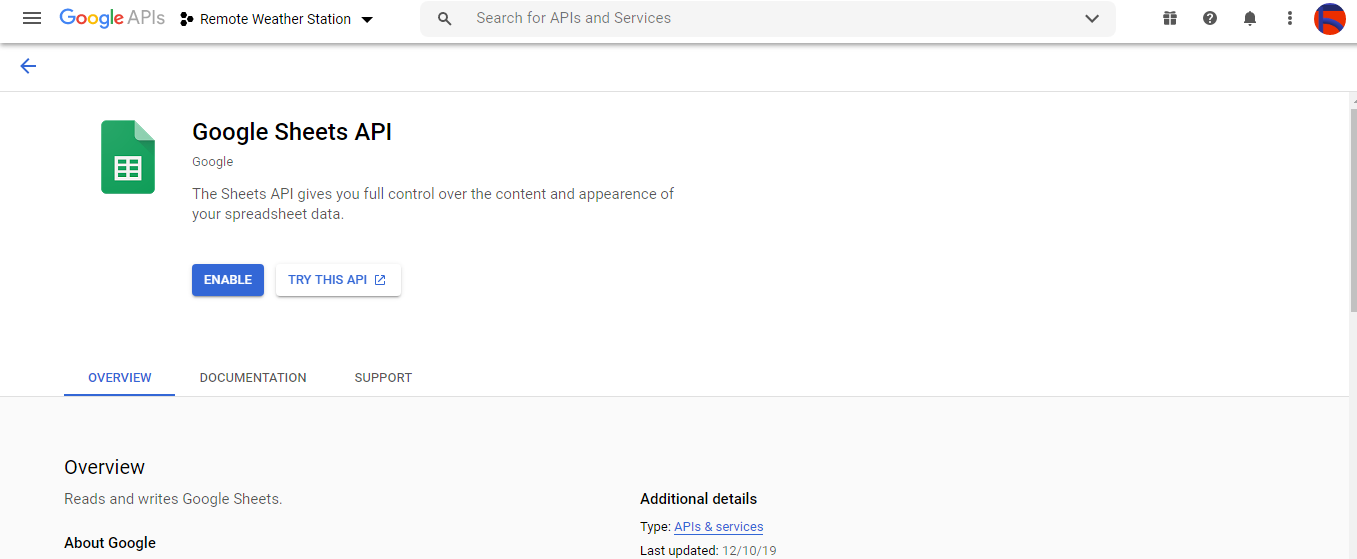
⭐ Vaya a API y servicios y haga clic en la biblioteca de API para habilitar la API de Google Sheets.
Paso 2.1:Obtener credenciales para usar la API de Hojas de cálculo de Google
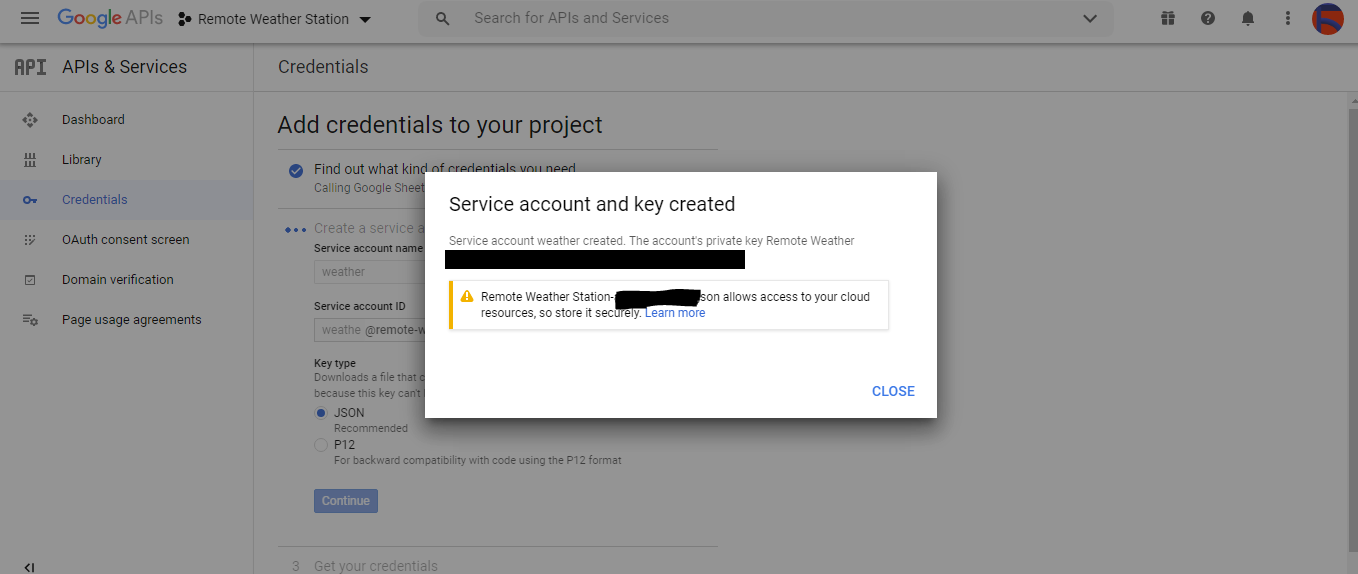
⭐ Abra el panel del proyecto y haga clic en Credenciales botón. Luego, complete el formulario como se muestra a continuación para crear la cuenta de servicio y la clave.
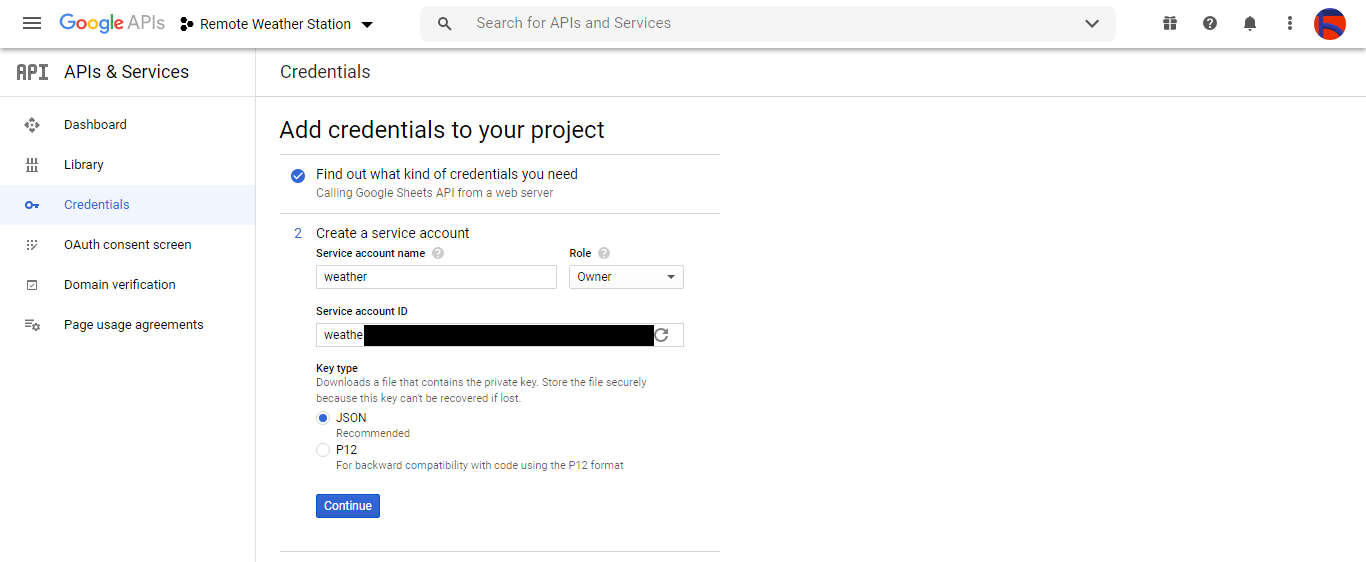
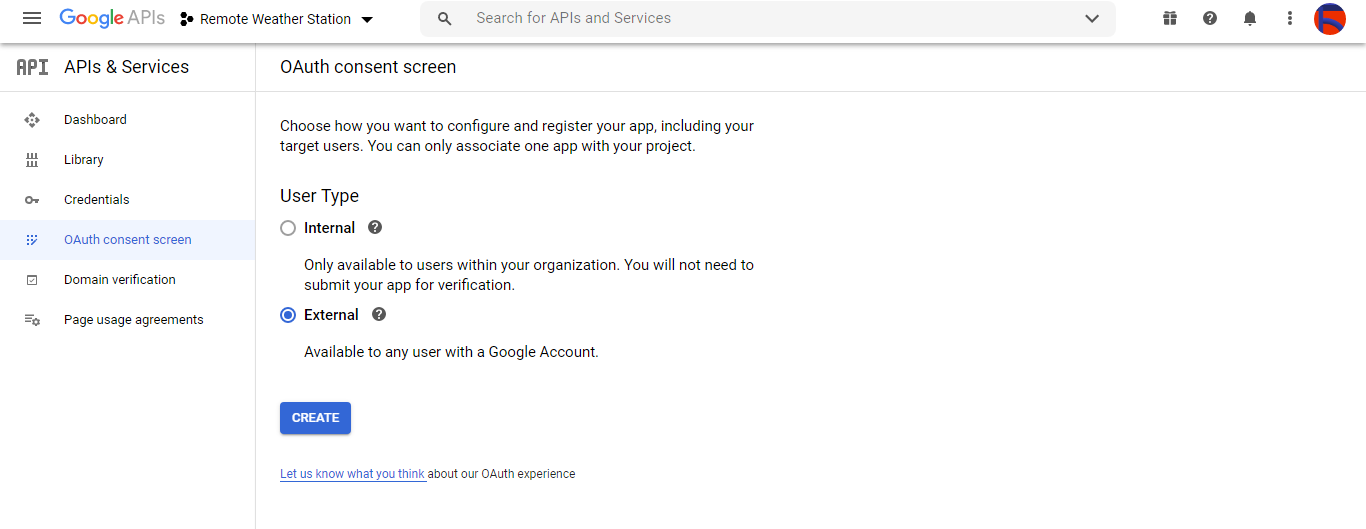
⭐ Haga clic en CREAR CREDENCIALES y configure la pantalla de consentimiento para poder crear una ID de cliente OAuth.
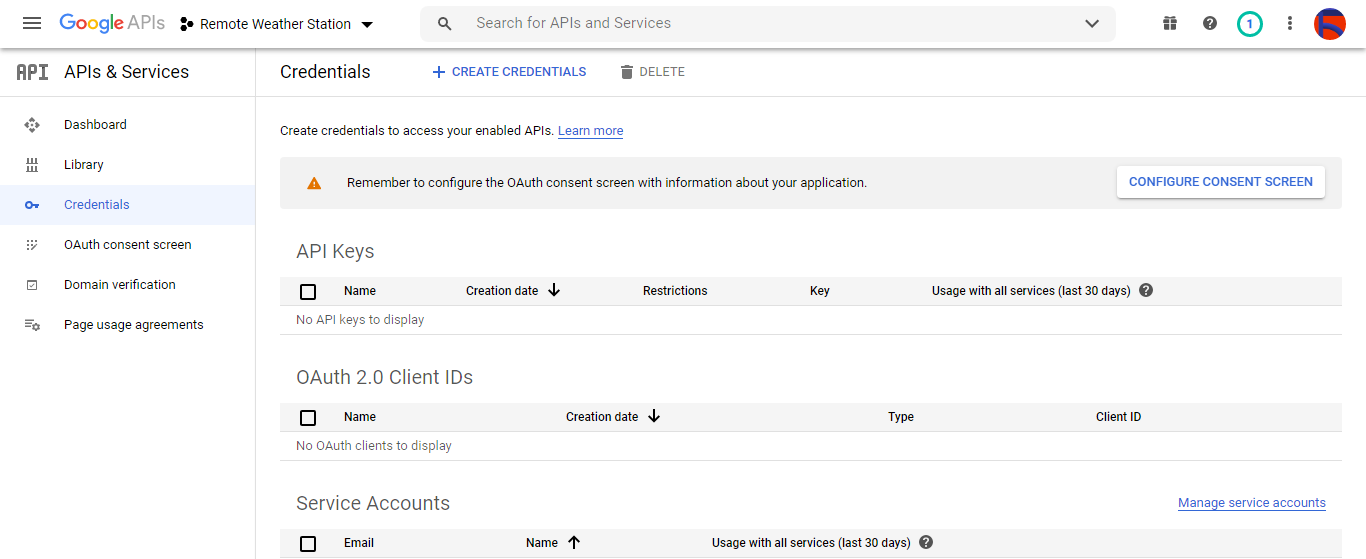
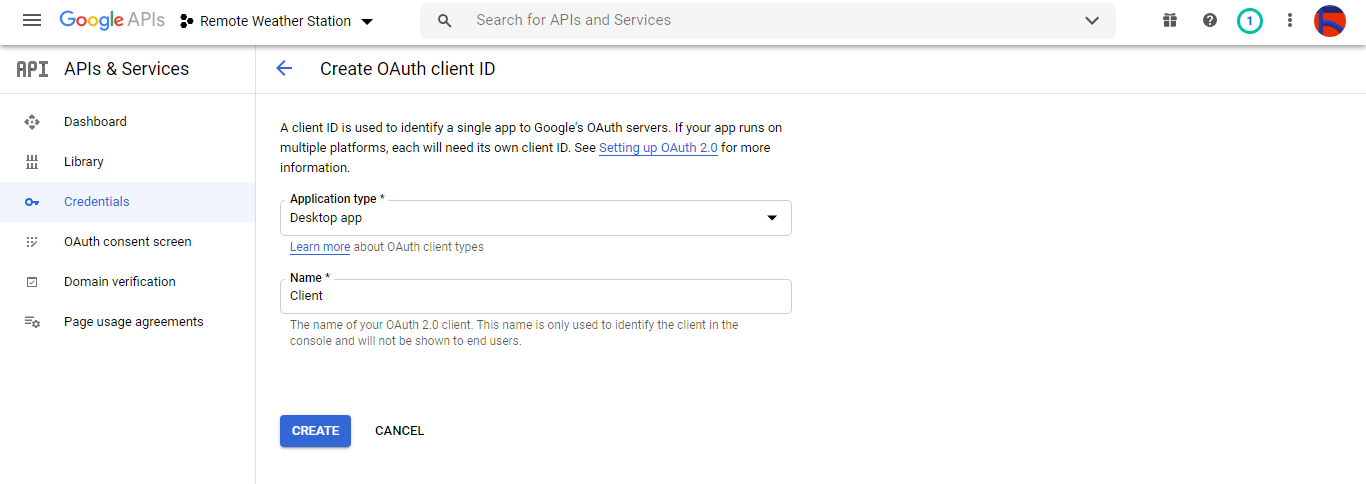
⭐ Luego, cree un nuevo ID de cliente de OAuth llamado Cliente en Aplicación de escritorio (tipo de aplicación).
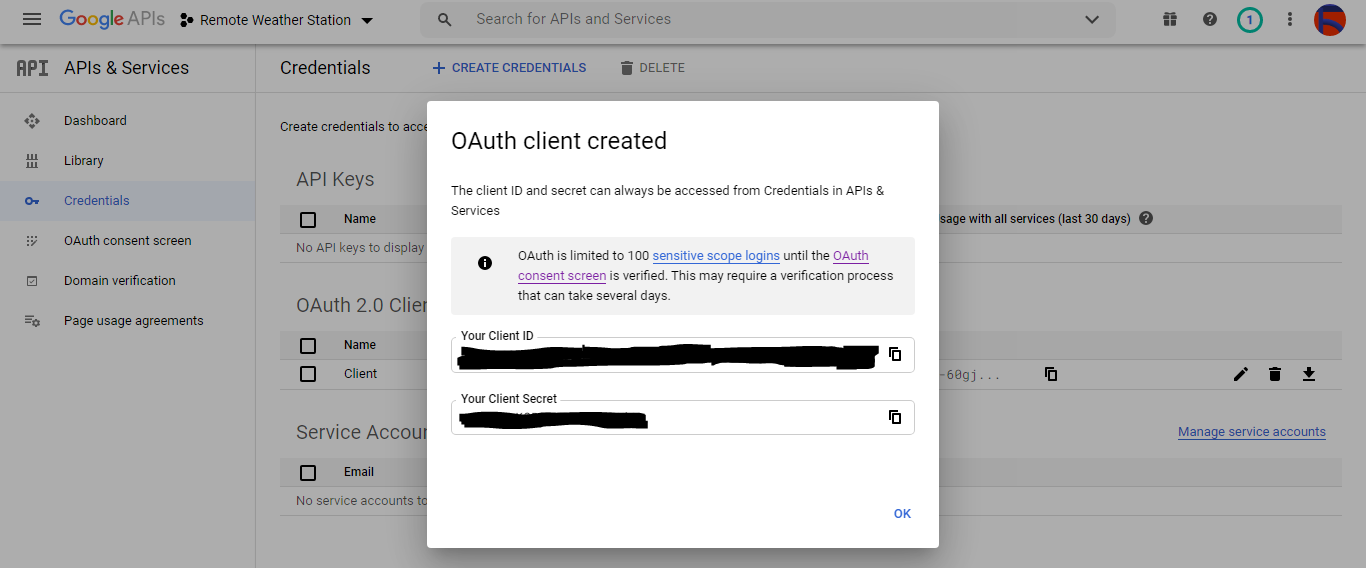
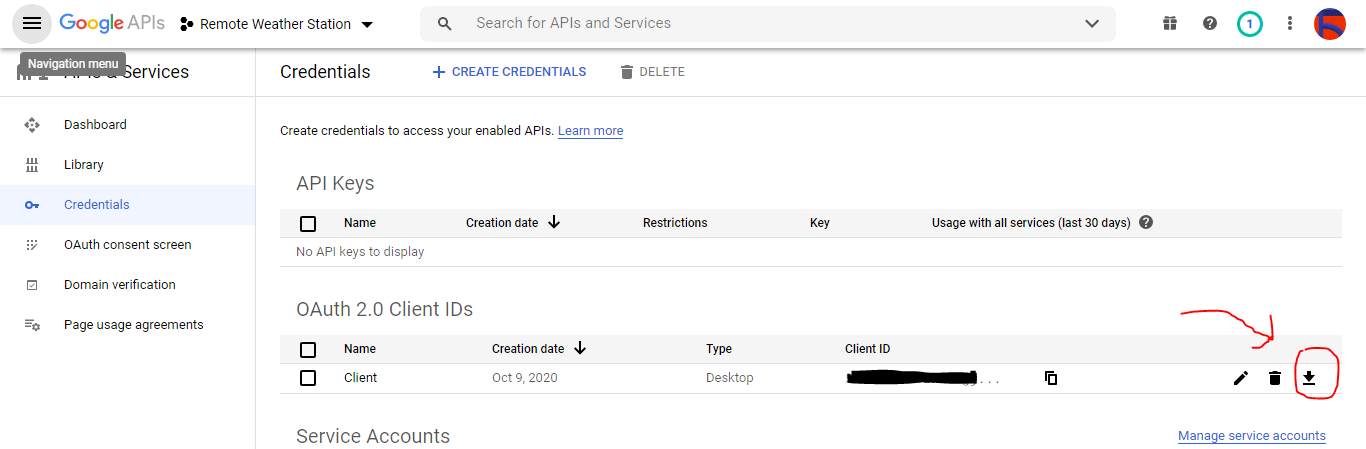
⭐ Después de crear el ID de cliente de OAuth (Cliente) descargue las credenciales (ID y Secreto) y nombre el archivo como credentials.json .
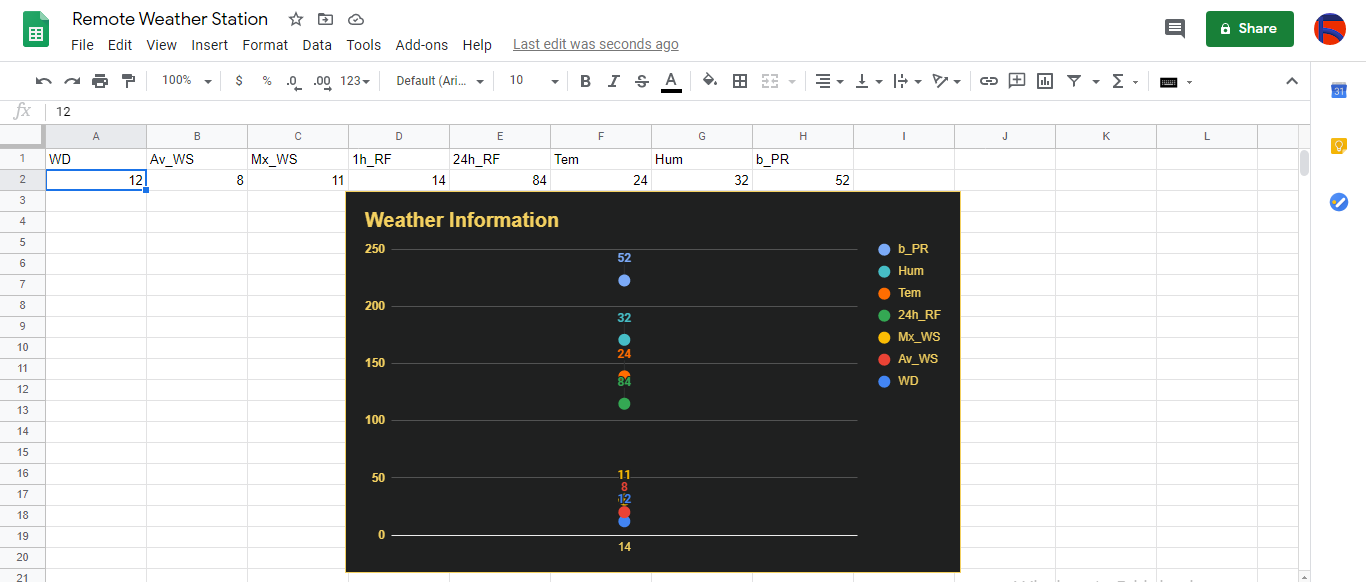
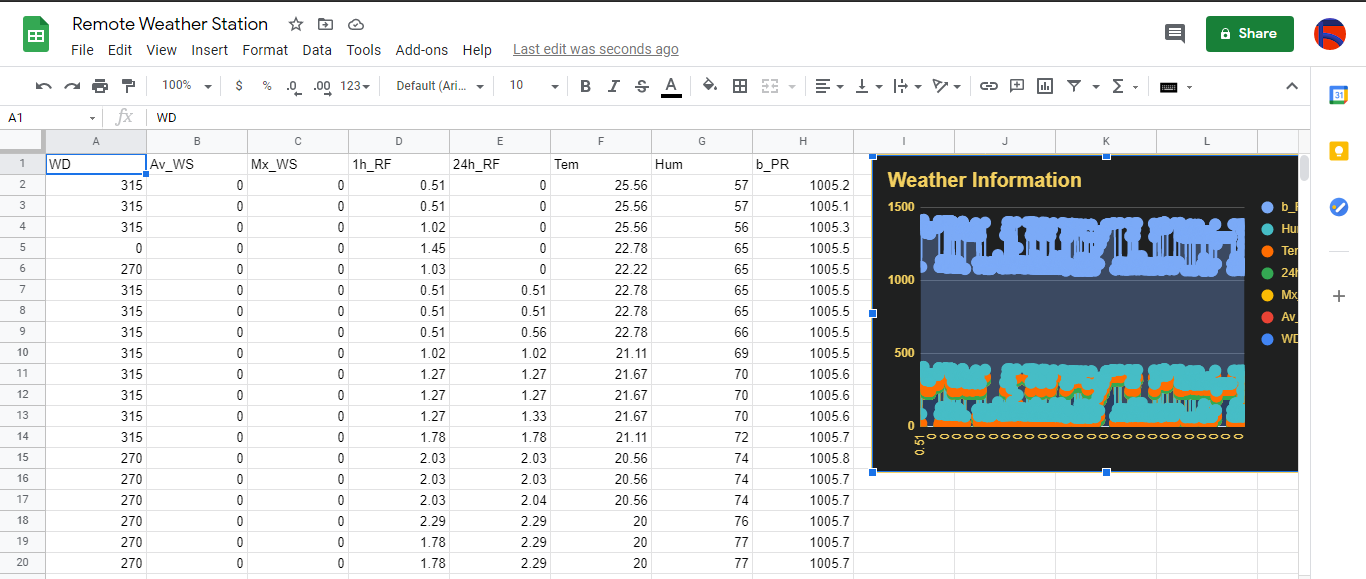
Paso 2.2:Creación de una hoja de cálculo en Hojas de cálculo de Google
⭐ Vaya a Hojas de cálculo de Google y seleccione Personal .

⭐ Cree un espacio en blanco hoja de cálculo y asígnele el nombre Estación meteorológica remota .
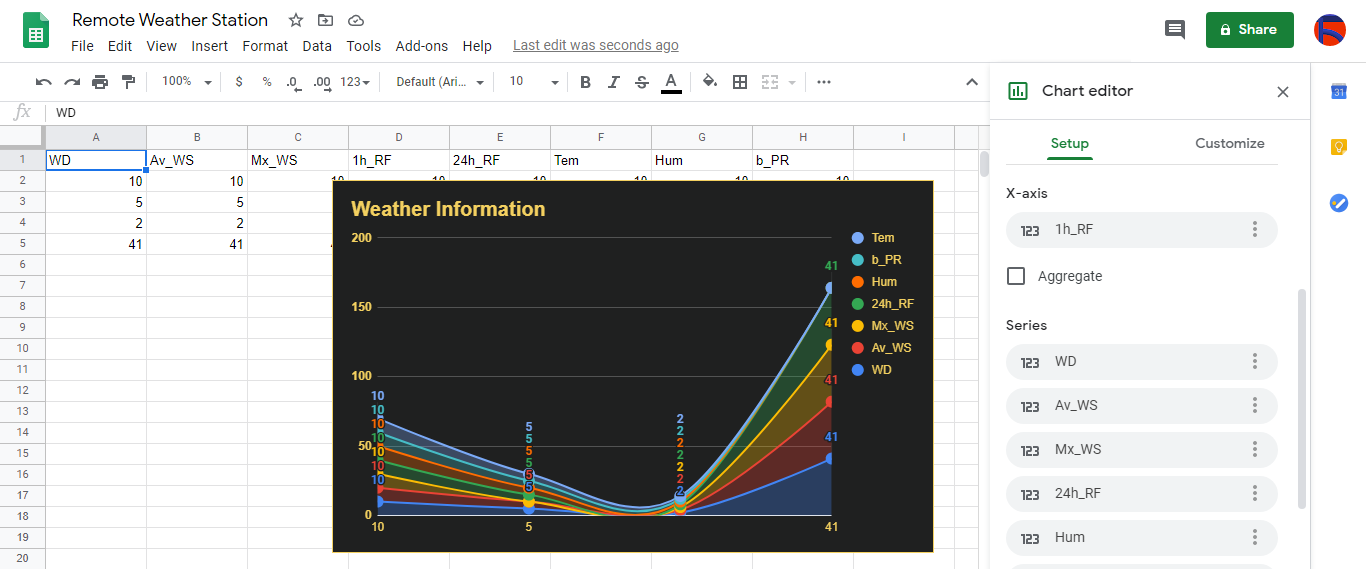
⭐ Luego, defina los nombres de las columnas como la primera fila:
- WD
- Av_WS
- Mx_WS
- 1h_RF
- 24 h_RF
- Tem
- Tararear
- b_PR
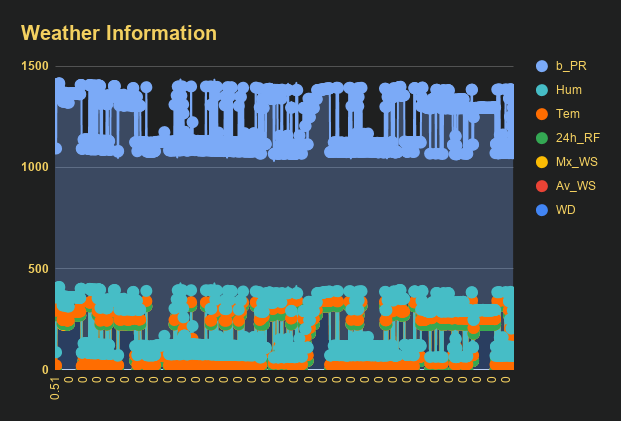
⭐ Si es necesario, modifique un gráfico para inspeccionar los datos recopilados, como hice yo.
Paso 3:desarrollo de una aplicación web en PHP para agregar datos meteorológicos a la hoja de cálculo
Esta aplicación web PHP es para obtener datos meteorológicos transferidos por las placas de desarrollo (ESP8266 y SIM808) a través de una solicitud HTTP Get y agregar esos datos a una hoja de cálculo determinada (por ID) en Google Sheets con credenciales y token verificados.
La aplicación web requiere que la biblioteca cliente de Google para PHP agregue datos meteorológicos a una hoja de cálculo determinada en Google Sheets.
⭐ Entonces, en primer lugar, cree una carpeta llamada remote_weather_station en su servidor e instale la biblioteca cliente de Google para PHP en él.
La estación meteorológica remota La carpeta debe incluir estos cuatro archivos además de la biblioteca cliente de Google para que funcione:
- index.php
- account_verification_token.php
- credentials.json (Paso 2.1)
- token.json (Paso 3.1)
En este paso, discutiré los dos primeros archivos:index.php y account_verification_token.php:
💻 index.php
⭐ Obtenga datos meteorológicos locales de la estación meteorológica a través de una solicitud Get:
// Dirección del viento (wd), Velocidad media del viento (a_ws), Velocidad máxima del viento (m_ws), Precipitación en 1 hora (1_rf), Precipitación en 24 horas (24_rf), Temperatura (tem), Humedad (hum), Presión barométrica (b_pr).
$ variables_from_module;
if (isset ($ _ GET ['wd']) &&isset ($ _ GET ['a_ws']) &&isset ($ _ GET ['m_ws'] ) &&isset ($ _ GET ['1_rf']) &&isset ($ _ GET ['24_rf']) &&isset ($ _ GET ['tem']) &&isset ($ _ GET ['hum']) &&isset ($ _ GET ['b_pr'])) {
$ variables_from_module =[
"wd" => (int) $ _ GET ['wd'],
"a_ws" => (float) $ _ GET ['a_ws'],
"m_ws" => (float) $ _ GET ['m_ws'],
"1_rf" => (float) $ _ GET ['1_rf'],
"24_rf" => (float) $ _ GET ['24_rf'],
"tem" => (float) $ _ GET ['tem'],
"hum" => (int) $ _ GET ['hum'],
"b_pr" => (float) $ _ GET ['b_pr']
];
} else {
$ variables_from_module =[
"wd" => "err",
"a_ws" => "err",
"m_ws" => "err",
"1_rf" => "err",
"24_rf" => "err",
"tem" => "err",
"hum" => "err",
"b_pr" => "err"
];
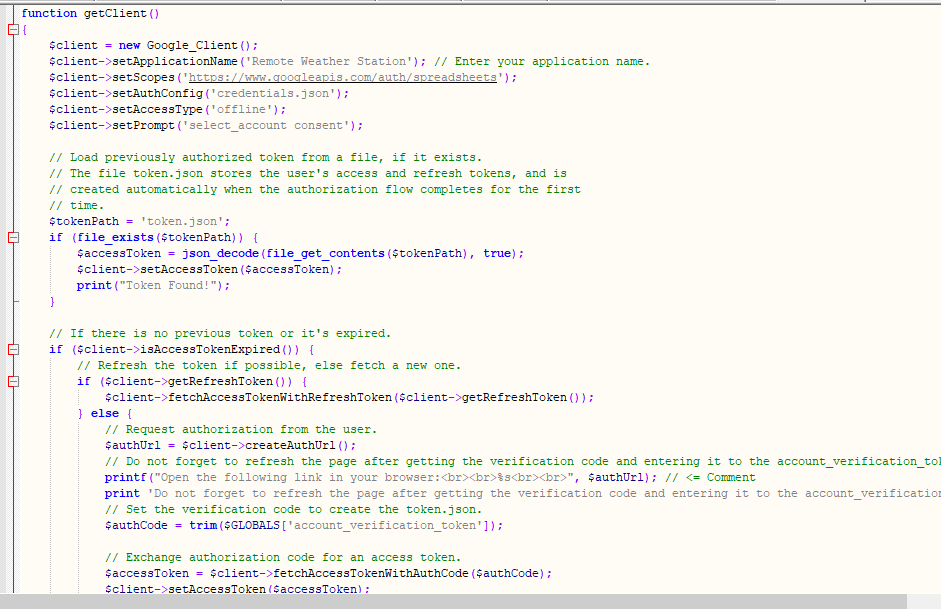
} ⭐ Conéctese a la aplicación Google Developer Console llamada Estación meteorológica remota mediante el uso de credentials.json archivo (paso 2.1) .
  $ client =new Google_Client ();
 $ client-> setApplicationName ('Estación meteorológica remota'); // Ingrese el nombre de su aplicación.
 $ client-> setScopes ('https://www.googleapis.com/auth/spreadsheets');
 $ client-> setAuthConfig ('credentials.json');
 $ cliente-> setAccessType ('sin conexión');
 $ cliente-> setPrompt ('select_account consent');
⭐ Cargue el token autorizado previamente desde un archivo ( token.json ), si existe.
$ tokenPath ='token.json';
if (file_exists ($ tokenPath)) {
$ accessToken =json_decode (file_get_contents ($ tokenPath), true);
$ cliente-> setAccessToken ($ accessToken);
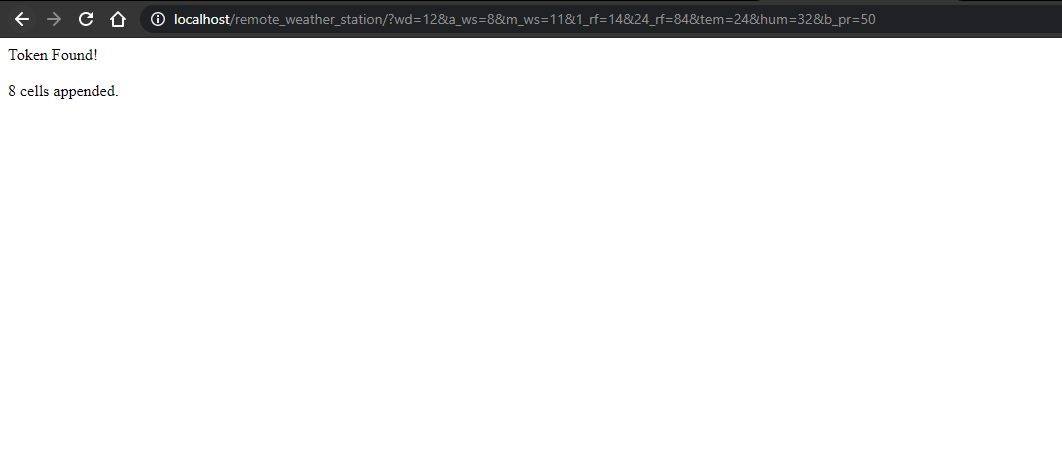
print ("¡Token encontrado!");
} ⭐ Si no hay un token anterior o vencido, solicite la autorización del usuario y configure el código de verificación para crear el token.json archivo con file_put_contents () función.
if ($ client-> isAccessTokenExpired ()) {
// Actualiza el token si es posible, de lo contrario, busca uno nuevo.
if ($ client-> getRefreshToken ()) {
$ client-> fetchAccessTokenWithRefreshToken ($ client-> getRefreshToken ());
} else {
// Solicita la autorización del usuario.
$ authUrl =$ client-> createAuthUrl ();
...
// Establezca el código de verificación para crear el token.json.
$ authCode =trim ($ GLOBALS ['account_verification_token' ]);
...
// Verifique si hubo un error y si se ingresó el token de verificación de cuenta.
if (array_key_exists ('error', $ accessToken)) {
lanzar una nueva excepción (join (',', $ accessToken));
} else {
print ("¡Exitoso! Actualizar la página.");
}
}
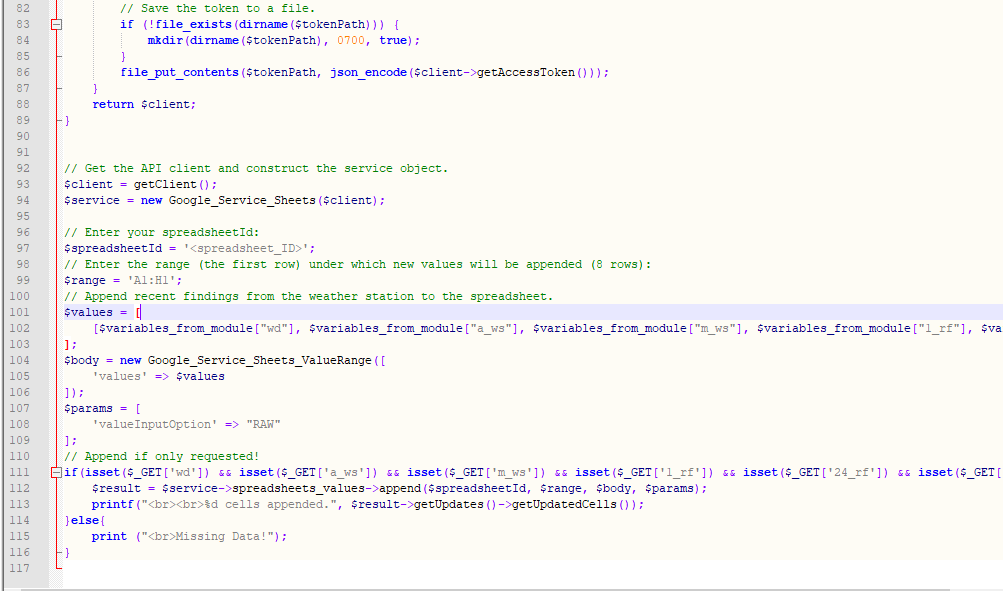
// Guarde el token en un archivo.
if (! file_exists (dirname ($ tokenPath))) {
mkdir (dirname ($ tokenPath), 0700 , verdadero);
}
file_put_contents ($ tokenPath, json_encode ($ client-> getAccessToken ()));
} ⭐ Ingrese el ID y el rango de la hoja de cálculo para agregar hallazgos recientes de la estación meteorológica a la hoja de cálculo.
https://docs.google.com/spreadsheets/d/spreadsheetId/edit#gid=0
// Ingrese su spreadsheetId:
$ spreadsheetId ='';
// Ingrese el rango (la primera fila) bajo el cual se agregarán nuevos valores (8 filas) :
$ range ='A1:H1';
// Adjunte los hallazgos recientes de la estación meteorológica a la hoja de cálculo.
$ values =[
[$ variables_from_module ["wd" ], $ variables_from_module ["a_ws"], $ variables_from_module ["m_ws"], $ variables_from_module ["1_rf"], $ variables_from_module ["24_rf"], $ variables_from_module ["tem"], $ variables_from_module, $ variables_from_module ["b_pr"]]
];
$ body =new Google_Service_Sheets_ValueRange ([
'valores' => $ valores
]);
$ params =[
'valueInputOption' => "RAW"
];
...
$ result =$ service-> spreadsheets_values-> append ( $ spreadsheetId, $ range, $ body, $ params);
printf ("
% d celdas adjuntas.", $ result-> getUpdates () -> getUpdatedCells ()); 💻 account_verification_token.php
⭐ Después de autorizar la aplicación web mediante la AuthUrl creada , ingrese el código de verificación proporcionado para configurar un token de acceso.
$ account_verification_token =""; // Ingrese el código de verificación después de la autorización.
Paso 3.1:Configurar la aplicación web en Raspberry Pi (o cualquier servidor)
Después de crear la aplicación web PHP, decidí ejecutarla en mi Raspberry Pi, pero puedes ejecutar la aplicación en cualquier servidor siempre que sea un servidor PHP.
Si desea utilizar Raspberry Pi pero no sabe cómo configurar un servidor web LAMP en Raspberry Pi, puede revisar este tutorial.
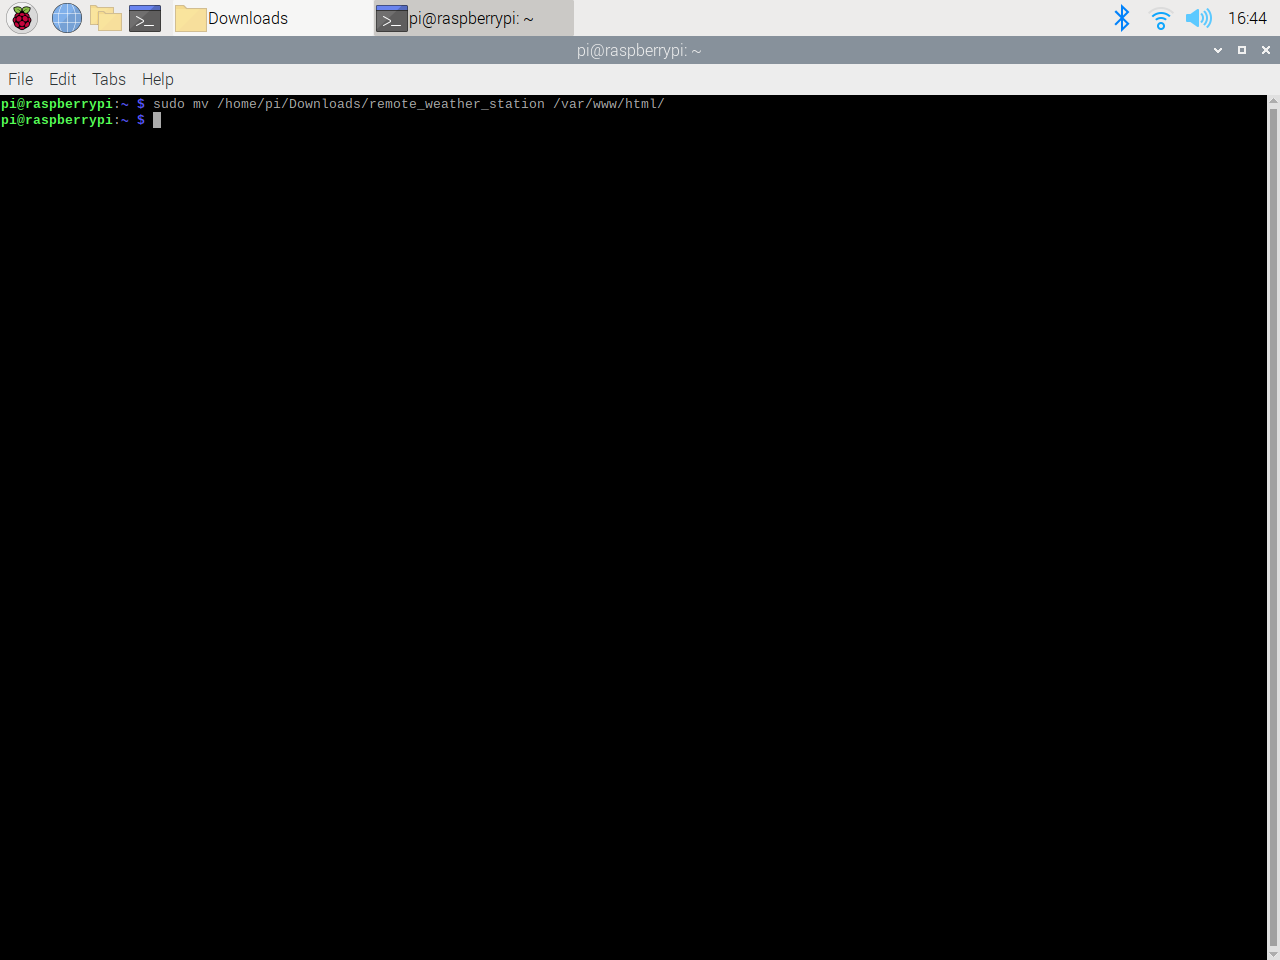
⭐ En primer lugar, mueva la carpeta de la aplicación (remote_weather_station) al servidor apache (/ var / www / html) utilizando la terminal, ya que el servidor apache es una ubicación protegida.
sudo mv / home / pi / Downloads / remote_weather_station / var / www / html /
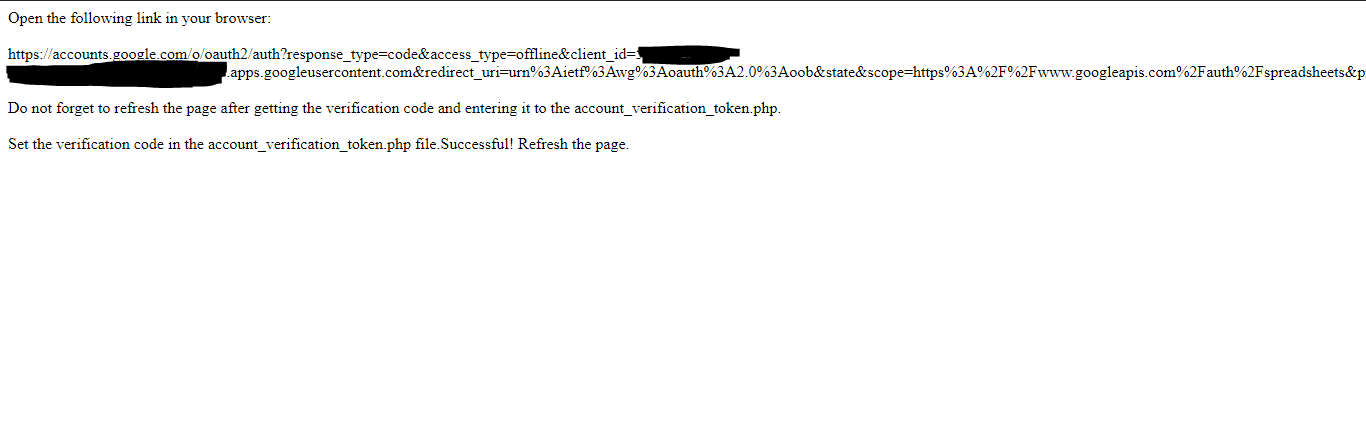
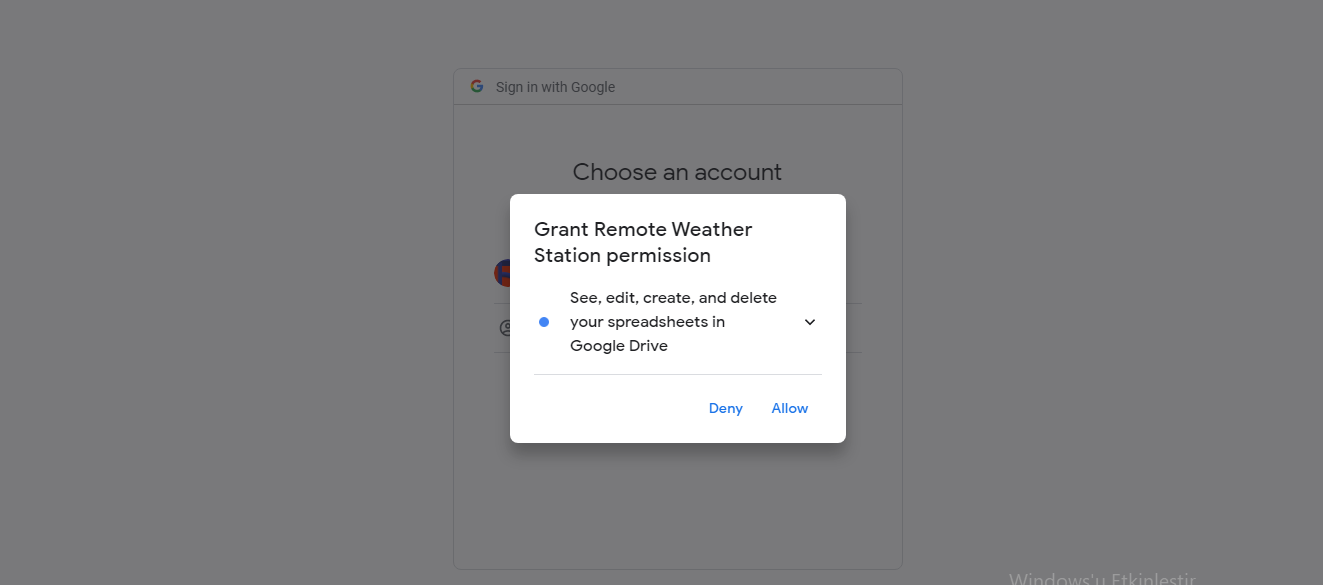
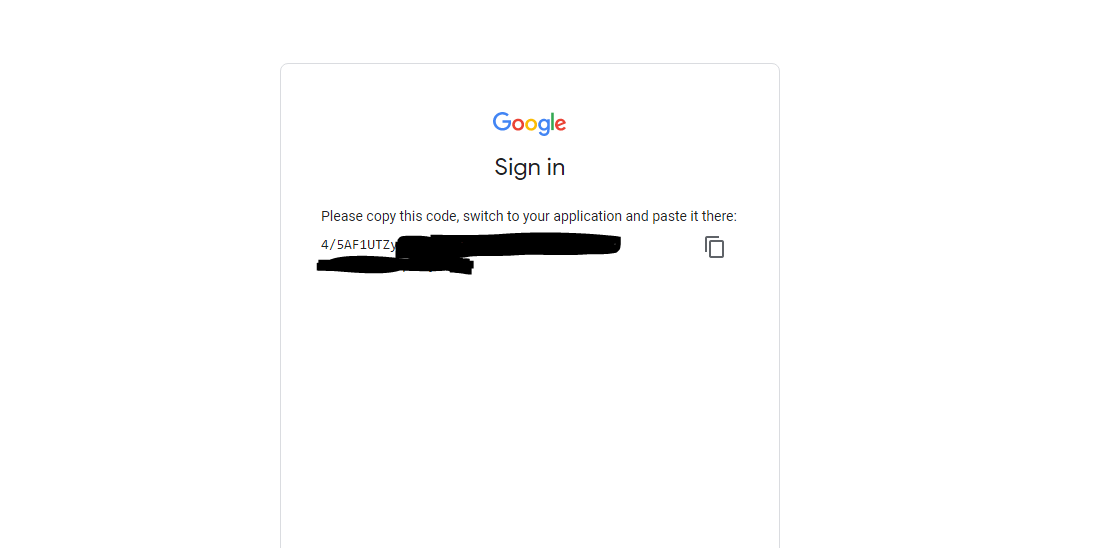
⭐ La aplicación web arroja un error cuando se abre por primera vez debido a que falta el código de verificación. Para obtener el código de verificación, vaya al enlace de autorización generado por la aplicación.
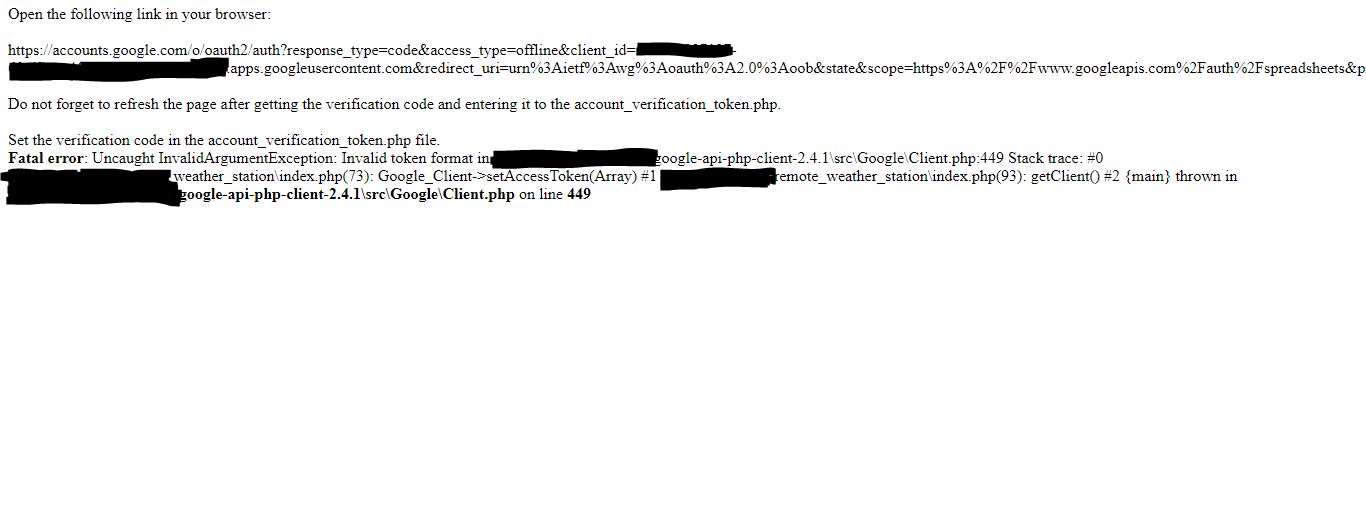
⭐ Luego, haga clic para Ir a la estación meteorológica remota (inseguro) .
⭐ Otorgue a la aplicación los permisos necesarios.
⭐ Ahora, copie el código de verificación y péguelo en account_verification_token.php .
⭐ Regrese a la aplicación web. Debería mostrar el mensaje de confirmación: ¡Exitoso! Actualizar la página .
⭐ Después de actualizar la página, la aplicación web usa el código de verificación para obtener un token de acceso y guarda el token de acceso en un archivo llamado token.json . Por lo tanto, no vuelve a lanzar un error.

⭐ Para probar si la aplicación web PHP está agregando datos nuevos a la hoja de cálculo proporcionada con precisión:
http:// localhost / remote_weather_station /? wd =12 &a_ws =8 &m_ws =11 &1_rf =14 &24_rf =84 &tem =24 &hum =32 &b_pr =57
Paso 4:leer y enviar datos meteorológicos con ESP8266 (WiFi)
Para recopilar datos meteorológicos en mi balcón, utilicé una placa de desarrollo NodeMCU ESP-12E (ESP8266) con la estación meteorológica.
Lo programé para enviar datos meteorológicos a la aplicación web PHP cada cinco minutos.

⭐ Incluya las bibliotecas necesarias y defina la configuración de WiFi.
#include
#include
#include
#include
#include
// Defina su configuración de WiFi.
const char * ssid ="";
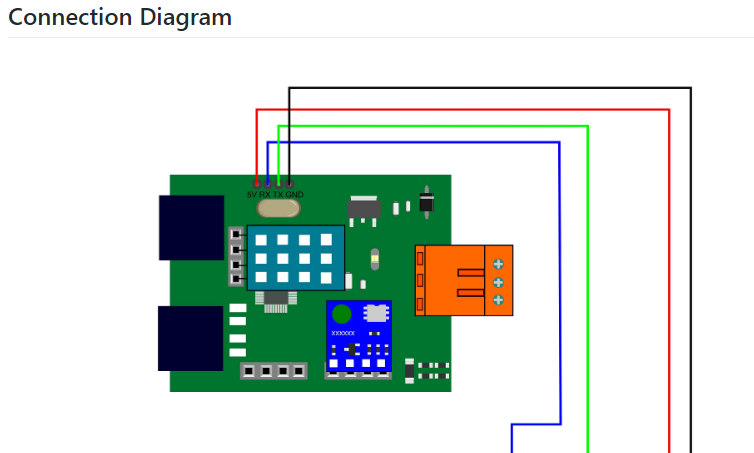
const char * password =" "; ⭐ Defina la configuración de la estación meteorológica y los pines de conexión en serie:D6, D5.
  // Defina la configuración de la estación meteorológica:
 char databuffer [35];
 double temp;
 int transferring =0;

 // Defina los pines de conexión en serie - RX y TX.
 SoftwareSerial Serial_1 (D6, D5); // (Rx, Tx)
⭐ En getBuffer () función, obtenga datos de la estación meteorológica.
  void getBuffer () {
 int index;
 for (index =0; index <35; index ++) {
 if (Serial_1.available ()) {
 búfer de datos [índice] =Serial_1.read ();
 if (búfer de datos [0]! ='c') {
 índice =-1;
}
 }
 else {
 índice -;
}
}
}
⭐ Depura los datos meteorológicos y crea el enlace.
  String weather_data ="wd =" + String (WindDirection ()) + "&a_ws =" + String (WindSpeedAverage ()) + "&m_ws =" + String (WindSpeedMax ()) + "&1_rf =" + Cadena (RainfallOneHour ()) + "&24_rf =" + Cadena (RainfallOneDay ()) + "&tem =" + Cadena (Temperatura ()) + "&hum =" + Cadena (Humedad ()) + "&b_pr =" + Cadena ( BarPressure ());
 String server ="http://192.168.1.24/remote_weather_station/?";

 ...

 int WindDirection () { return transCharToInt (databuffer, 1,3); } // Dirección del viento (grados)

 float WindSpeedAverage () {temp =0.44704 * transCharToInt (databuffer, 5,7); temperatura de retorno; } // Velocidad del aire promedio (1 minuto)

 float WindSpeedMax () {temp =0.44704 * transCharToInt (databuffer, 9,11); temperatura de retorno; } // Velocidad máxima del aire (5 minutos)

 temperatura de flotación () {temp =(transCharToInt (databuffer, 13,15) - 32.00) * 5.00 / 9.00; temperatura de retorno; } // Temperatura ("C")

 float RainfallOneHour () {temp =transCharToInt (databuffer, 17,19) * 25.40 * 0.01; temperatura de retorno; } // Lluvia (1 hora)

 float RainfallOneDay () {temp =transCharToInt (databuffer, 21,23) * 25.40 * 0.01; temperatura de retorno; } // Lluvia (24 horas)

 int Humidity () {return transCharToInt (databuffer, 25,26); } // Humedad (%)

 float BarPressure () {temp =transCharToInt (databuffer, 28,32); temperatura de retorno / 10,00; } // Presión barométrica (hPA)
⭐ Envíe paquetes de datos cada 5 minutos a Raspberry Pi (o cualquier servidor).
  transfiriendo ++; Serial.println ("Time =>" + String (transfiriendo) + "s /" + String (int (5 * 60)) + "s \ n \ n");
 if (transfiriendo ==5 * 60) {
 // Crea el objeto HTTP para realizar una solicitud al servidor.
 HTTPClient http;
 http.begin(server + weather_data);
 int httpCode =http.GET();
 String payload =http.getString();
 Serial.println("Data Send...\nHTTP Code => " + String(httpCode) + "\nServer Response => " + payload + "\n\n");
 http.end();
 transferring =0;
 }
 // Wait 1 second...
 delay(1000);
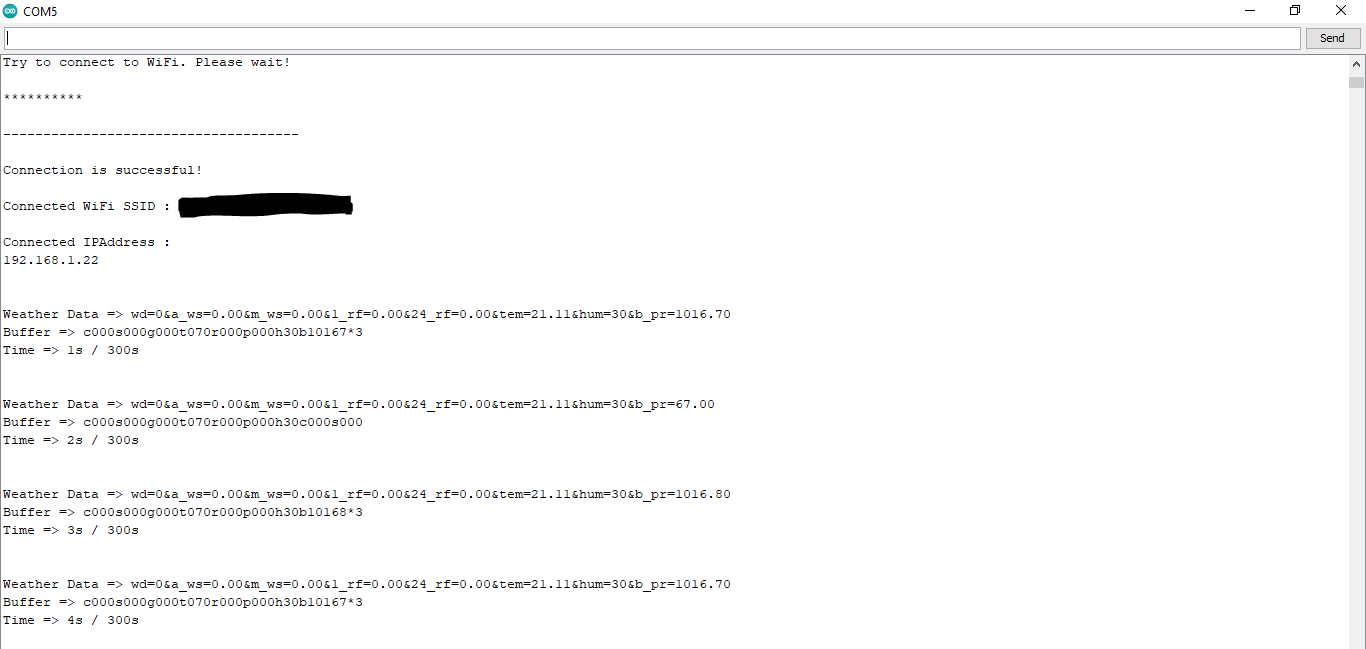
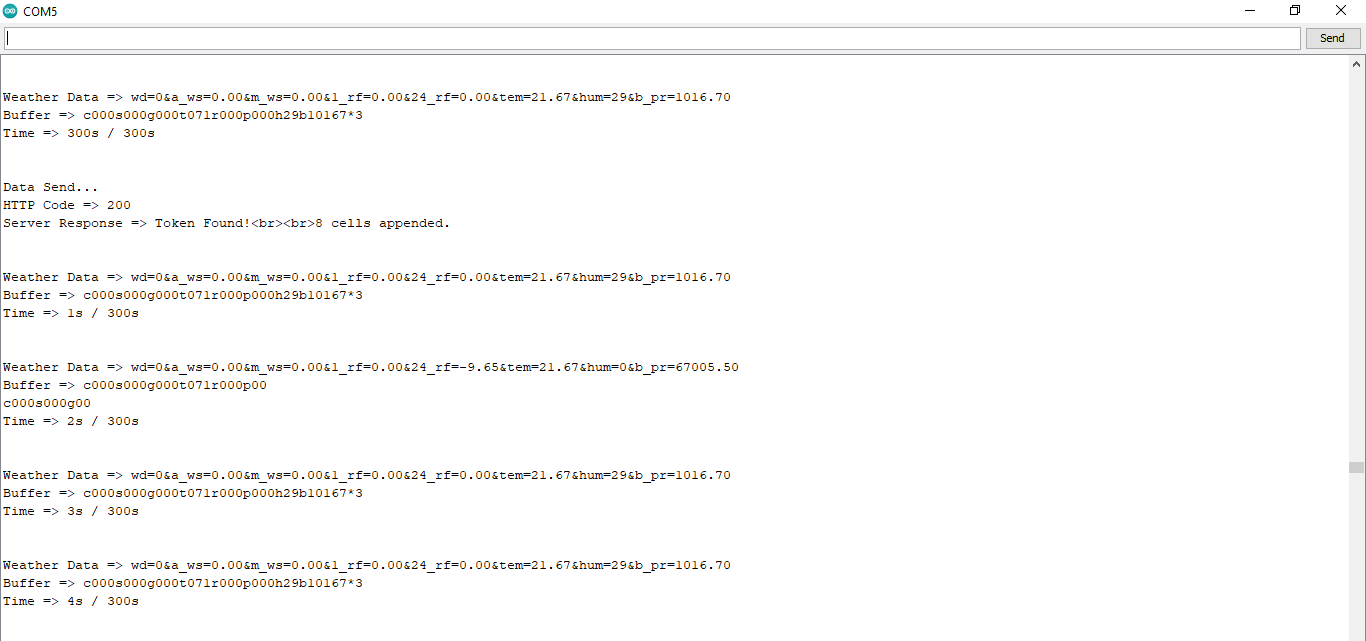
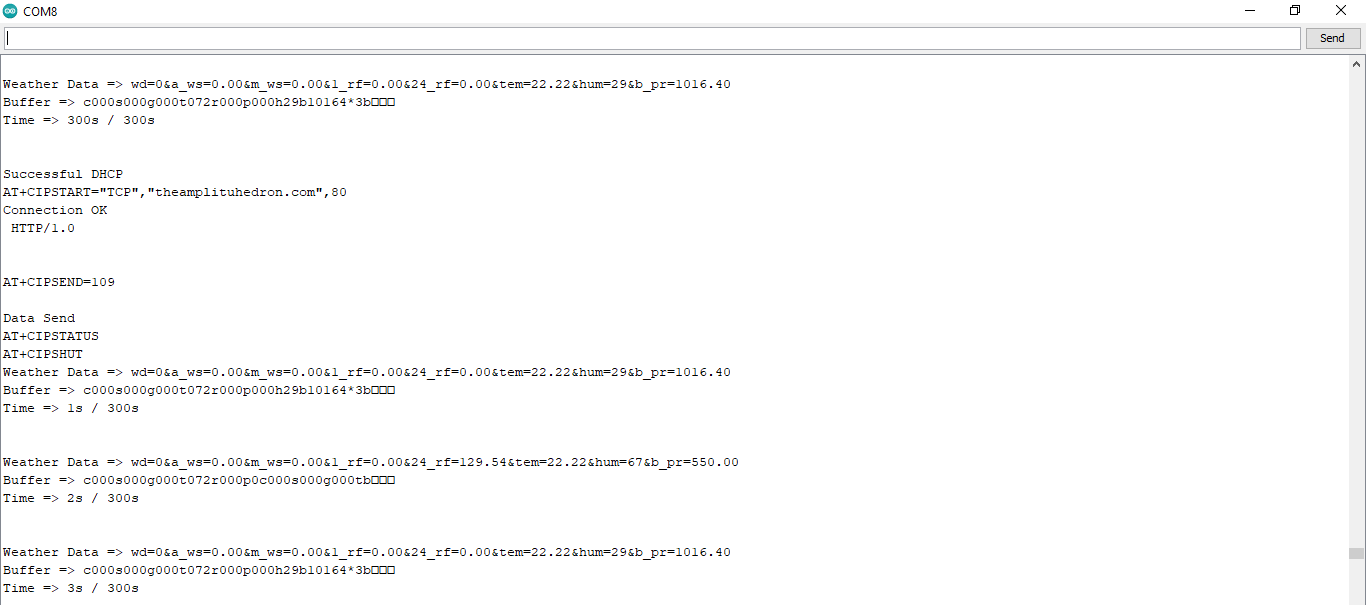
⭐ After uploading the code to the NodeMCU ESP-12E (ESP8266) development board, it displays weather data every second on the serial monitor and sends data packets every five minutes (300 seconds) to the PHP web application.
Connection is successful!

...

Weather Data => wd=0&a_ws=0.00&m_ws=0.00&1_rf=0.00&24_rf=0.00&tem=21.67&hum=29&b_pr=1016.70
Buffer => c000s000g000t071r000p000h29b10167*3
Time => 299s / 300s


Weather Data => wd=0&a_ws=0.00&m_ws=0.00&1_rf=0.00&24_rf=0.00&tem=21.67&hum=29&b_pr=1016.70
Buffer => c000s000g000t071r000p000h29b10167*3
Time => 300s / 300s

...
⭐ Then, it shows the response from the server.
...

Data Send...
HTTP Code => 200
Server Response => Token Found!

8 cells appended.

...
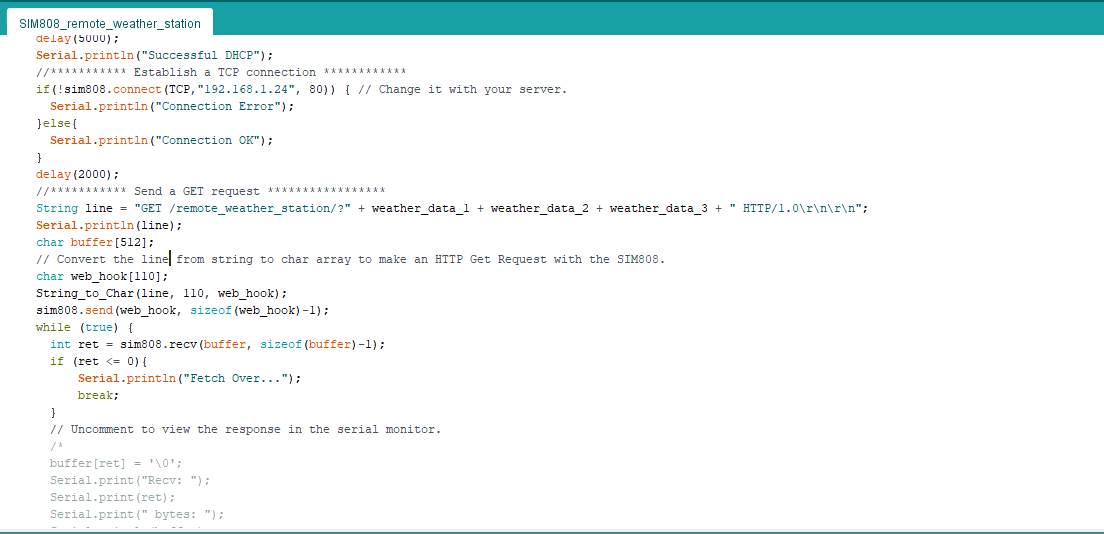
Step 4.1:Reading and sending weather data with SIM808 (GPRS)
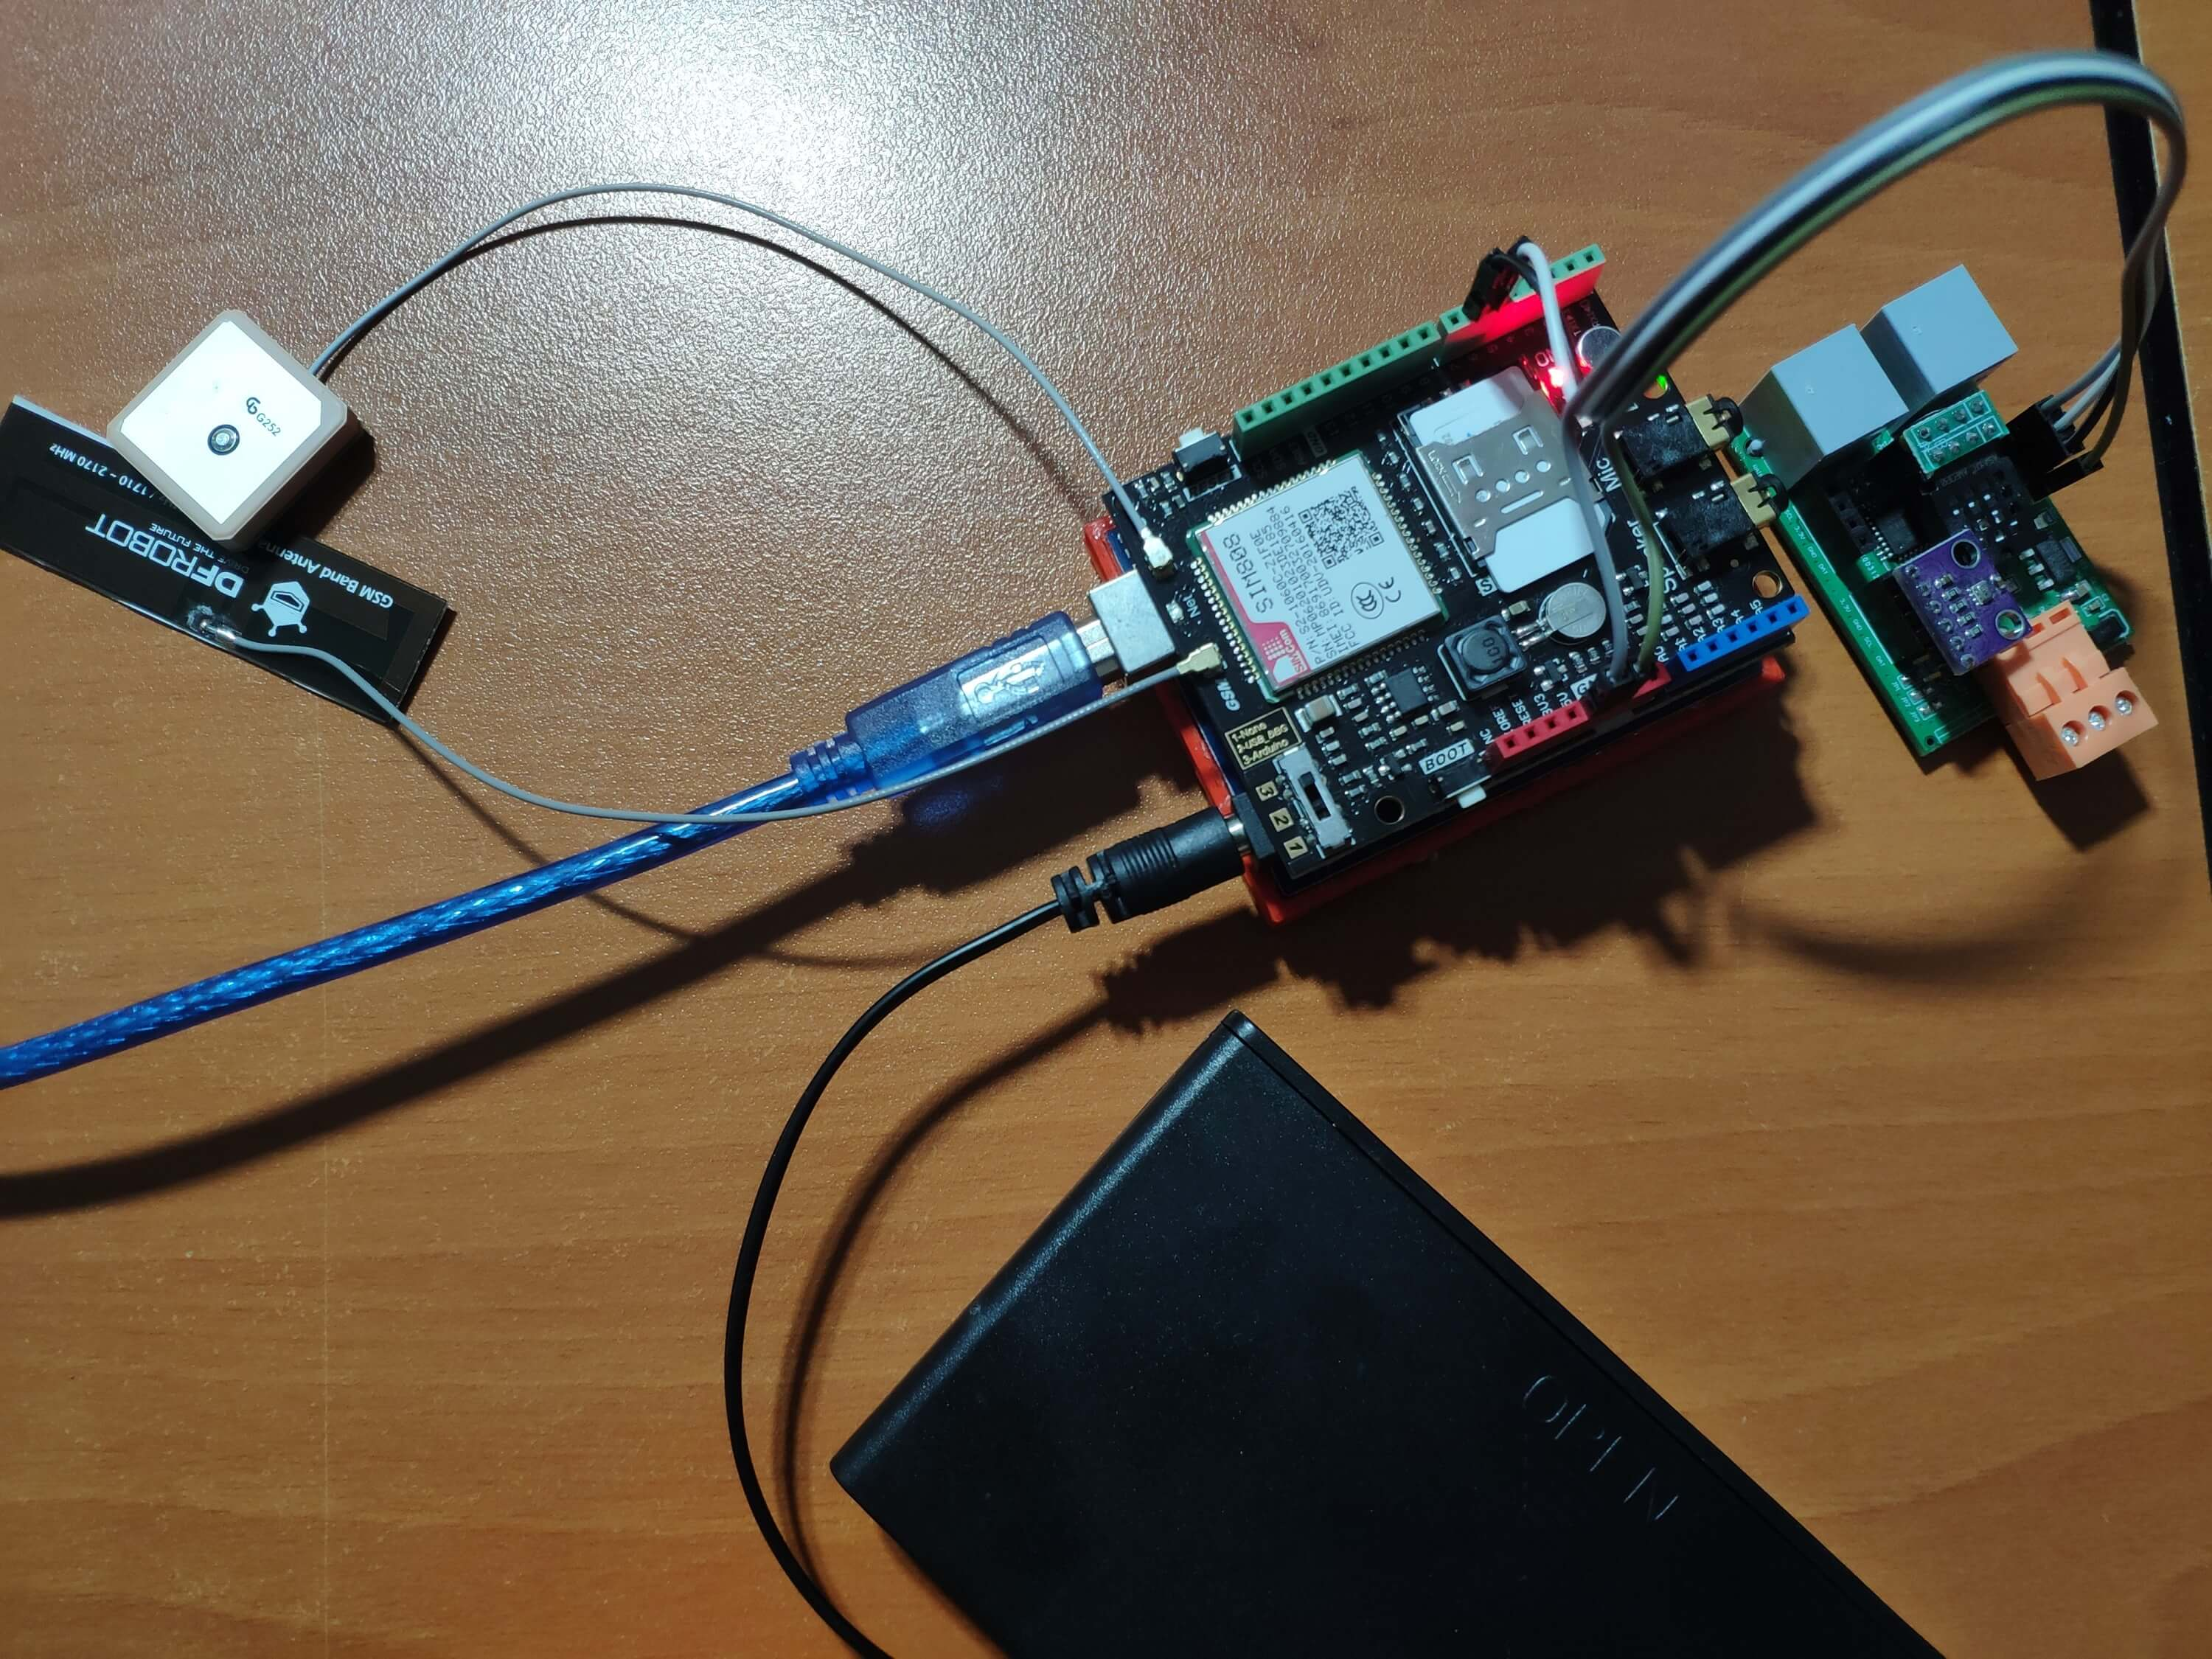
To collect weather data in my backyard, I used a SIM808 shield for Arduino Uno if the distance between the weather station and my router is too far away.
Most of the code is the same and covered in the previous step aside from the parts below.
⭐ Include required libraries and define the sim808 object.
For SIM808 GPS/GPRS/GSM Shield | Download
#include
#include

// Define the sim808.
DFRobot_SIM808 sim808(&Serial);
⭐ Initialize the SIM808 module and continue if it is working accurately.
//******** Initialize sim808 module *************
while(!sim808.init()) {
delay(1000);
Serial.print("Sim808 init error\r\n");
}
delay(2000);
// Continue if the SIM808 Module is working accurately.
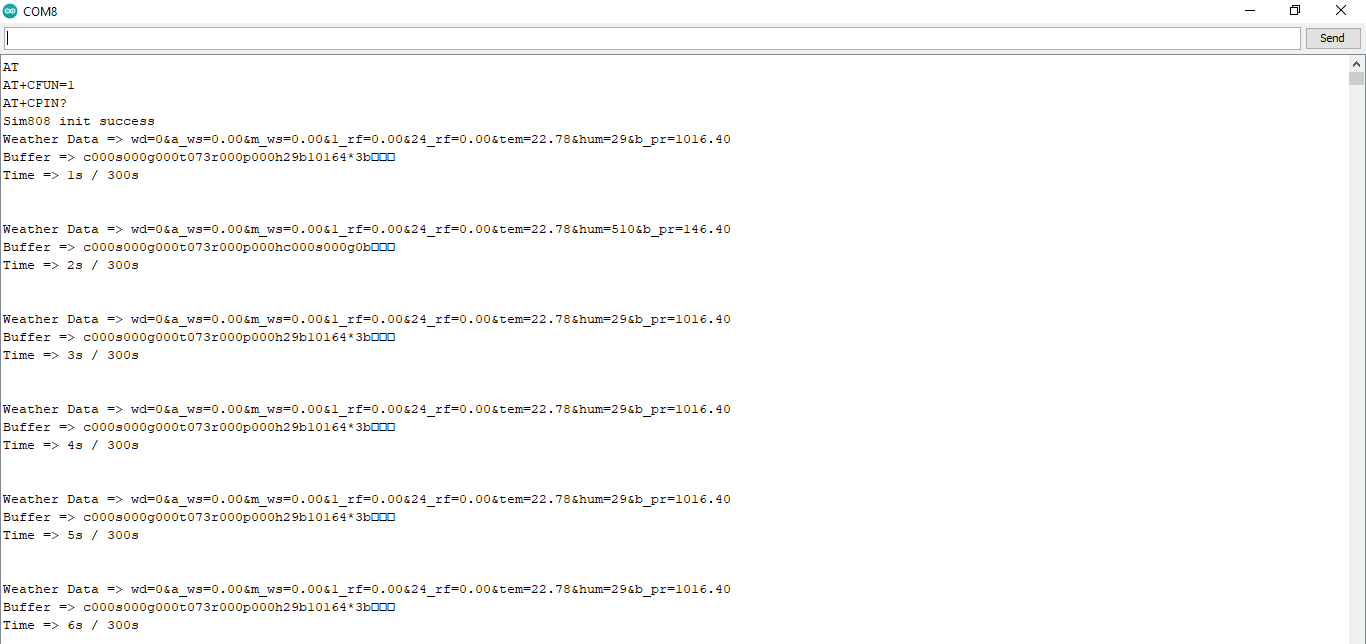
Serial.println("Sim808 init success");
delay(5000); ⭐ Send data packets every 5 minutes to the server by establishing a TCP connection to make a GET request.
transferring++; Serial.println("Time => " + String(transferring) + "s / " + String(int(5*60)) + "s\n\n");
 if(transferring ==5*60){
 //*********** Attempt DHCP *******************
 while(!sim808.join(F("cmnet"))) {
 Serial.println("Sim808 join network error!");
 delay(2000);
 }
 //************ Successful DHCP ****************
 delay(5000);
 Serial.println("Successful DHCP");
 //*********** Establish a TCP connection ************
 if(!sim808.connect(TCP,"192.168.1.24", 80)) { // Change it with your server.
 Serial.println("Connection Error");
 }else{
 Serial.println("Connection OK");
 }
 delay(2000);

 ...
⭐ After creating the line string, convert it from string to char array to make an HTTP Get Request with the SIM808.
...

 String line ="GET /remote_weather_station/?" + weather_data_1 + weather_data_2 + weather_data_3 + " HTTP/1.0\r\n\r\n";
 Serial.println(line);
 char buffer[512];
 // Convert the line from string to char array to make an HTTP Get Request with the SIM808.
 char web_hook[110];
 String_to_Char(line, 110, web_hook);
 sim808.send(web_hook, sizeof(web_hook)-1);
 while (true) {
 int ret =sim808.recv(buffer, sizeof(buffer)-1);
 if (ret <=0){
 Serial.println("Fetch Over...");
 break;
 }

 ...
⭐ After uploading the code to the SIM808 shield, it displays weather data every second on the serial monitor and sends data packets every five minutes (300 seconds) to the PHP web application.
Step 4.2:Creating the weather data set for more than three months
After finishing coding, I started to collate weather data on Google Sheets every five minutes for more than three months to build a neural network model and make predictions on the rainfall intensity.
Collected Weather Data:
- Wind Direction (deg)
- Average Wind Speed (m/s)
- Max Wind Speed (m/s)
- One-Hour Rainfall (mm)
- 24-Hours Rainfall (mm)
- Temperature (°C)
- Humidity (%)
- Barometric Pressure (hPa)
Then, I downloaded the spreadsheet as Remote Weather Station.csv , consisting of 32219 rows as my preliminary local weather data set. I am still collating weather data to improve my data set and model :)
Step 5:Building an Artificial Neural Network (ANN) with TensorFlow
When I completed collating my preliminary local weather data set, I started to work on my artificial neural network (ANN) model to make predictions on the rainfall intensity.
I decided to create my neural network model with TensorFlow in Python. So, first of all, I followed the steps below to grasp a better understanding of the weather data:
- Data Visualization
- Data Scaling (Normalizing)
- Data Preprocessing
- Data Splitting
After applying these steps, I decided to use my neural network model to classify different rainfall intensity classes theoretically assigned as labels (outputs) for each input (row). I created my classes according to the rate of precipitation, which depends on the considered time.
The following categories are used to classify rainfall intensity by the rate of precipitation (rainfall):
- Light rain — when the precipitation rate is <2.5 mm per hour
- Moderate rain — when the precipitation rate is between 2.5 mm and 7.6 mm per hour
- Heavy rain — when the precipitation rate is between 7.6 mm and 50 mm per hour
- Violent rain — when the precipitation rate is> 50 mm per hour
According to the precipitation (rainfall) rates, I preprocessed the weather data to assign one of these five classes for each input as its label:
- 0 (None)
- 1 (Light Rain)
- 2 (Moderate Rain)
- 3 (Heavy Rain)
- 4 (Violent Rain)
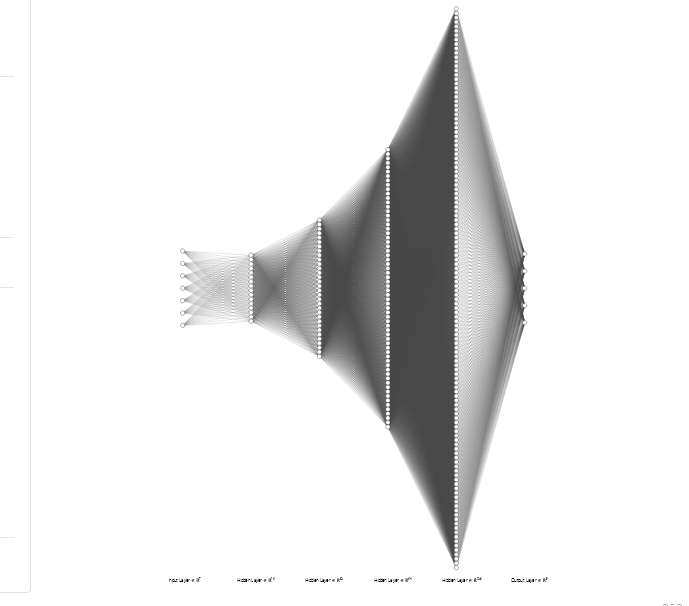
After scaling (normalizing) and preprocessing the weather data, I elicited seven input variables and one label for each reading, classified with the five mentioned classes. Then, I built an artificial neural network model with TensorFlow to obtain the best possible results and predictions with my preliminary data set.
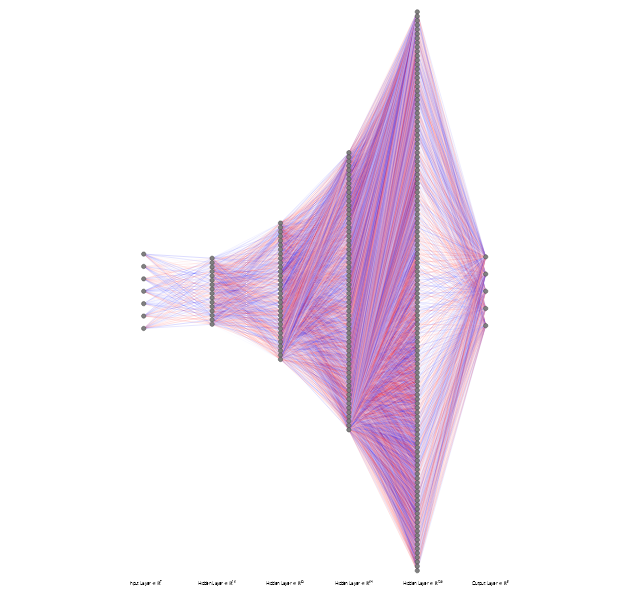
Layers:
- 7 [Input]
- 16 [Hidden]
- 32 [Hidden]
- 64 [Hidden]
- 128 [Hidden]
- 5 [Output]
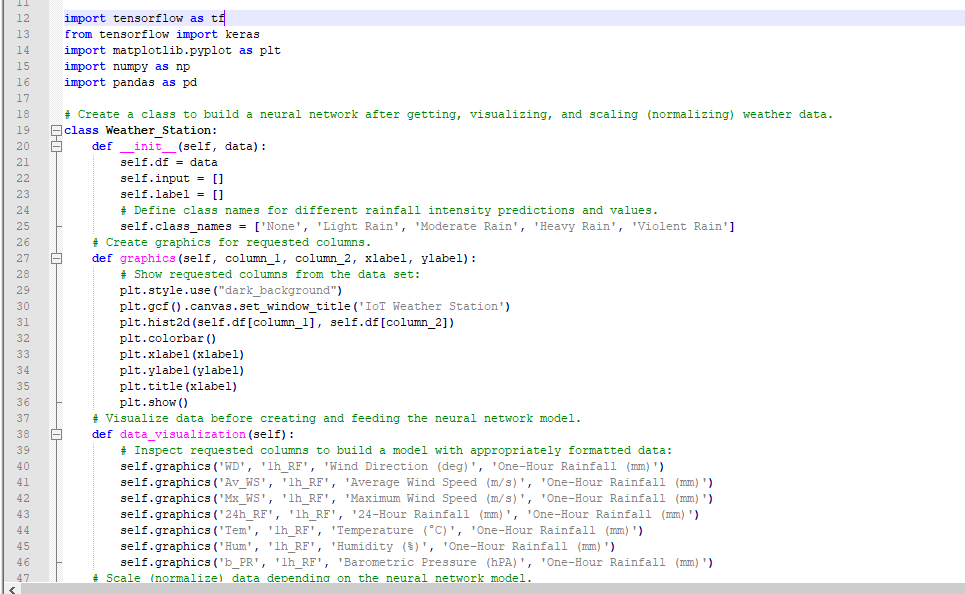
To execute all steps above, I created a class named Weather_Station in Python after including the required libraries:
import tensorflow as tf
from tensorflow import keras
import matplotlib.pyplot as plt
import numpy as np
import pandas as pd
Subsequently, I will discuss coding in Python for each step I mentioned above.
Also, you can download IoT_weather_station_neural_network.py to inspect coding.
Step 5.1:Visualizing and scaling (normalizing) the weather data
Before diving in to build a model, it is important to understand the weather data to pass the model appropriately formatted data.
So, in this step, I will show you how to visualize weather data and scale (normalize) in Python.
⭐ First of all, read the weather data from Remote Weather Station.csv .
csv_path ="E:\PYTHON\Remote Weather Station.csv"
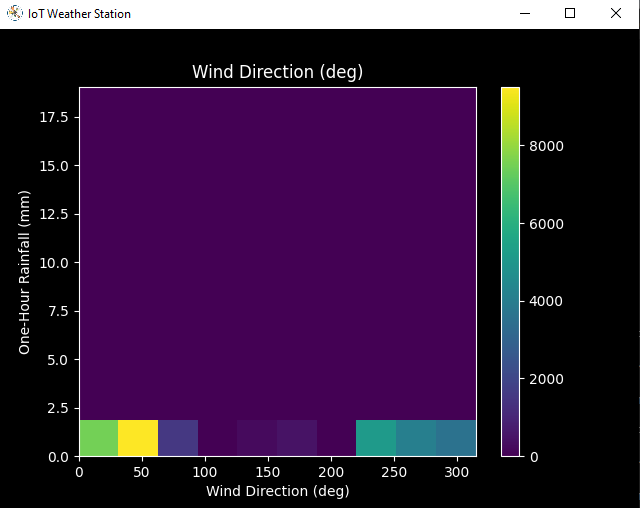
df =pd.read_csv(csv_path) ⭐ In the graphics() function, visualize the requested columns from the weather data set by using the Matplotlib library.
def graphics(self, column_1, column_2, xlabel, ylabel):
 # Show requested columns from the data set:
 plt.style.use("dark_background")
 plt.gcf().canvas.set_window_title('IoT Weather Station')
 plt.hist2d(self.df[column_1], self.df[column_2])
 plt.colorbar()
 plt.xlabel(xlabel)
 plt.ylabel(ylabel)
 plt.title(xlabel)
 plt.show()
⭐ In the data_visualization() function, inspect all columns before scaling weather data to build a model with appropriately formatted data.
def data_visualization(self):
# Inspect requested columns to build a model with appropriately formatted data:
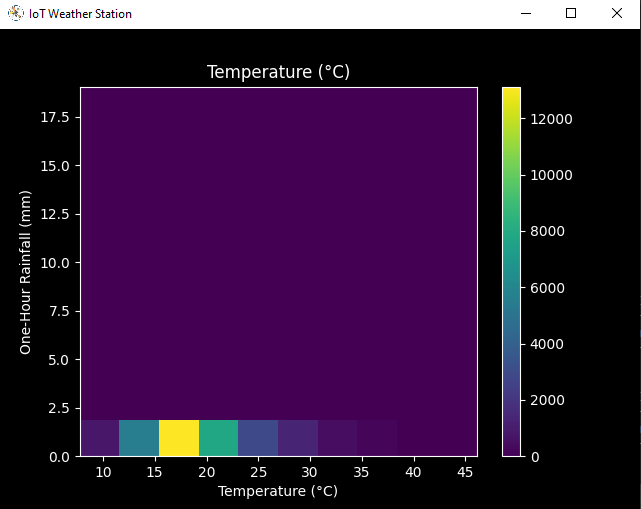
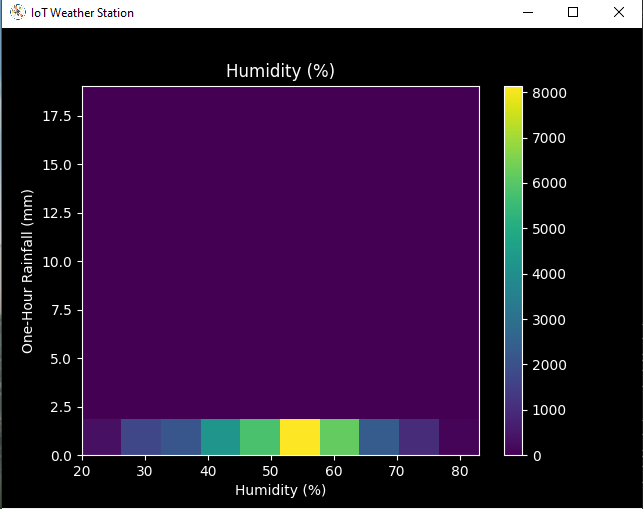
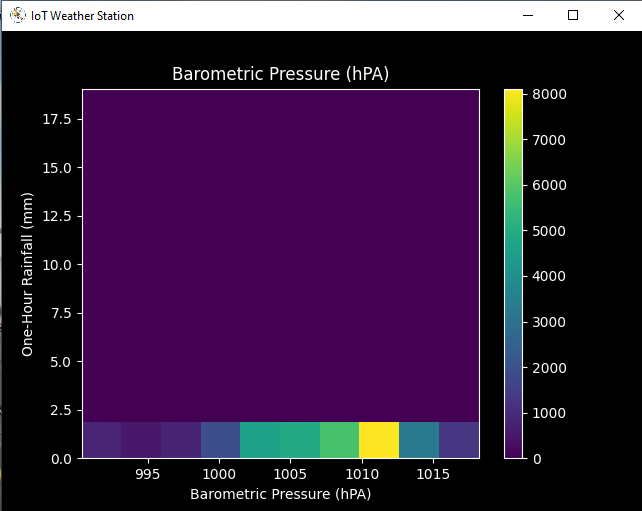
self.graphics('WD', '1h_RF', 'Wind Direction (deg)', 'One-Hour Rainfall (mm)')
self.graphics('Av_WS', '1h_RF', 'Average Wind Speed (m/s)', 'One-Hour Rainfall (mm)')
self.graphics('Mx_WS', '1h_RF', 'Maximum Wind Speed (m/s)', 'One-Hour Rainfall (mm)')
self.graphics('24h_RF', '1h_RF', '24-Hour Rainfall (mm)', 'One-Hour Rainfall (mm)')
self.graphics('Tem', '1h_RF', 'Temperature (°C)', 'One-Hour Rainfall (mm)')
self.graphics('Hum', '1h_RF', 'Humidity (%)', 'One-Hour Rainfall (mm)')
self.graphics('b_PR', '1h_RF', 'Barometric Pressure (hPA)', 'One-Hour Rainfall (mm)')
After visualizing weather data, I scaled (normalized) each column to format it properly.
Normally, each row (reading) looked like this before scaling:
- 315, 0.45, 0, 0.51, 0.51, 22.78, 65, 1005.5
⭐ In the scale_data() function:
⭐ The wind direction in units of degrees and angles do not make good model inputs. 360° and 0° should be close to each other and wrap around smoothly. The direction should not matter if the wind is not blowing. Thus, convert the wind direction and velocity columns to a wind vector to interpret them easily with a neural network model.
def scale_data(self):
 # Wind Direction and Speed:
 wv =self.df.pop('Av_WS')
 max_wv =self.df.pop('Mx_WS')
 # Convert to radians.
 wd_rad =self.df.pop('WD')*np.pi / 180
 # Calculate the wind x and y components.
 self.df['scaled_WX'] =wv*np.cos(wd_rad)
 self.df['scaled_WY'] =wv*np.sin(wd_rad)
 # Calculate the max wind x and y components.
 self.df['scaled_max_WX'] =max_wv*np.cos(wd_rad)
 self.df['scaled_max_WY'] =max_wv*np.sin(wd_rad)

 ...
⭐ For the remaining columns except for 1h_RF , divide them into average reading values to scale (normalize) and format.
...

 # Temperature:
 tem =self.df.pop('Tem')
 self.df['scaled_Tem'] =tem / 25
 # Humidity:
 hum =self.df.pop('Hum')
 self.df['scaled_Hum'] =hum / 70
 # Barometric Pressure:
 bPR =self.df.pop('b_PR')
 self.df["scaled_bPR"] =bPR / 1013
 # 24 Hour Rainfall (Approx.)
 rain_24 =self.df.pop('24h_RF')
 self.df['scaled_24h_RF'] =rain_24 / 24
After completing scaling (normalizing), I extracted these new columns from the weather data set:
- scaled_WX
- scaled_WY
- scaled_max_WX
- scaled_max_WY
- scaled_Tem
- scaled_Hum
- scaled_bPR
- scaled_24h_RF
Step 5.2:Training the model (ANN) on the rainfall intensity classes
Before building and training a neural network model in TensorFlow, I needed to create the input array and the label array by preprocessing the scaled and normalized weather data set.
⭐ In the create_input_and_label() function:
⭐ Firstly, append each input element as a NumPy array to the input array and convert it to a NumPy array by using the asarray() función.
⭐ Each input element includes seven variables [shape=(7, )]:
- [scaled_WX, scaled_WY, scaled_max_WX, scaled_max_WY, scaled_Tem, scaled_Hum, scaled_bPR]
def create_input_and_label(self):
 n =len(self.df)
 # Create the input array using the scaled variables:
 for i in range(n):
 self.input.append(np.array([self.df['scaled_WX'][i], self.df['scaled_WY'][i], self.df['scaled_max_WX'][i], self.df['scaled_max_WY'][i], self.df['scaled_Tem'][i], self.df['scaled_Hum'][i], self.df['scaled_bPR'][i]]))
 self.input =np.asarray(self.input)

 ...
⭐ Then, evaluate the approximate rainfall (precipitation) rate for each reading (row).
approx_RF_rate =(1h_RF + scaled_24h_RF) * 100
⭐ According to the rainfall rate, assign a class [0 - 4] for each input element and append them to the label array.
...
for i in range(n):
_class =0
# Evaluate the approximate rainfall rate:
approx_RF_rate =(self.df['1h_RF'][i] + self.df['scaled_24h_RF'][i]) * 100
# As labels, assign classes of rainfall intensity according to the approximate rainfall rate (mm):
if approx_RF_rate ==0:
_class =0
elif approx_RF_rate <2.5:
_class =1
elif 2.5
elif 7.6
else:
_class =4
self.label.append(_class)
self.label =np.asarray(self.label) After preprocessing the scaled weather data to create input and label arrays, I split them as training (60%) and test (40%) data sets:
def split_data(self):
n =len(self.df)
# (60%, 40%) - (training, test)
self.train_input =self.input[0:int(n*0.6)]
self.test_input =self.input[int(n*0.6):]
self.train_label =self.label[0:int(n*0.6)]
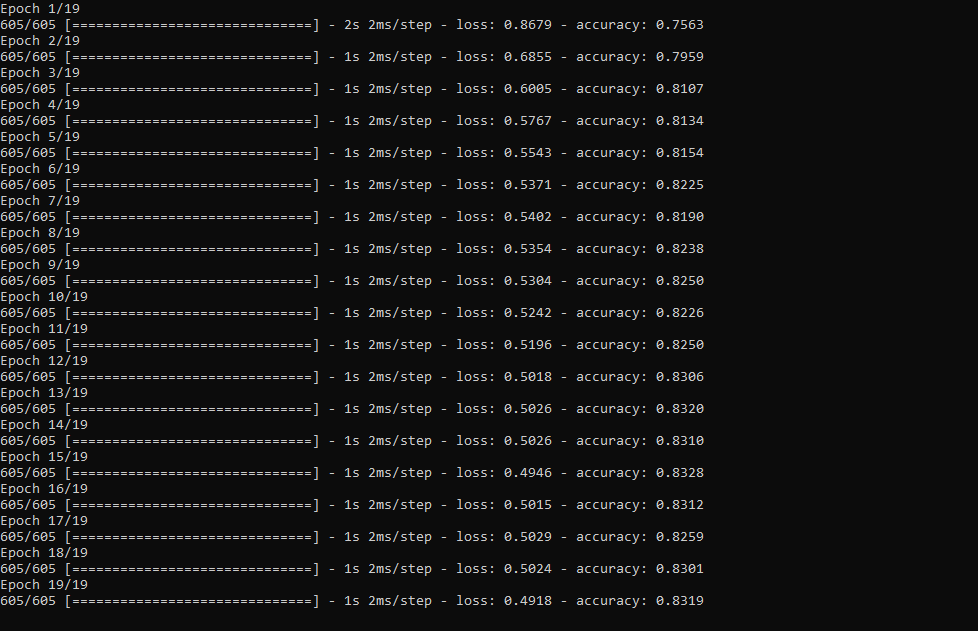
self.test_label =self.label[int(n*0.6):] Then, I built my artificial neural network (ANN) model by using Keras and trained it with the training data set for nineteen epochs.
You can inspect these tutorials to learn about activation functions, loss functions, epochs, etc.
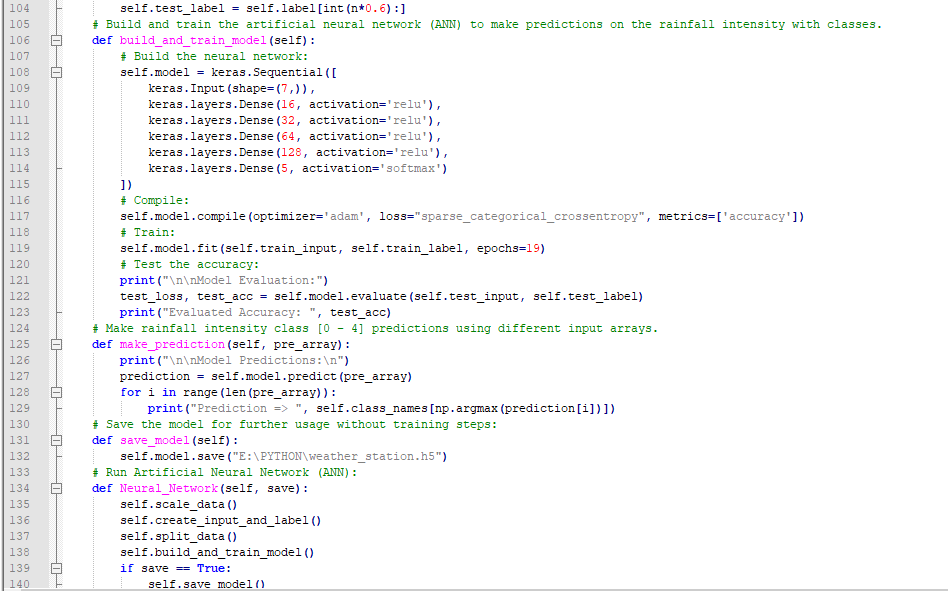
def build_and_train_model(self):
 # Build the neural network:
 self.model =keras.Sequential([
 keras.Input(shape=(7,)),
 keras.layers.Dense(16, activation='relu'),
 keras.layers.Dense(32, activation='relu'),
 keras.layers.Dense(64, activation='relu'),
 keras.layers.Dense(128, activation='relu'),
 keras.layers.Dense(5, activation='softmax')
 ])
 # Compile:
 self.model.compile(optimizer='adam', loss="sparse_categorical_crossentropy", metrics=['accuracy'])
 # Train:
 self.model.fit(self.train_input, self.train_label, epochs=19)

 ...
After training with the preliminary training data set, the accuracy of the model is between 0.83 and 0.85 .
Step 5.3:Evaluating the model and making predictions on the rainfall intensity
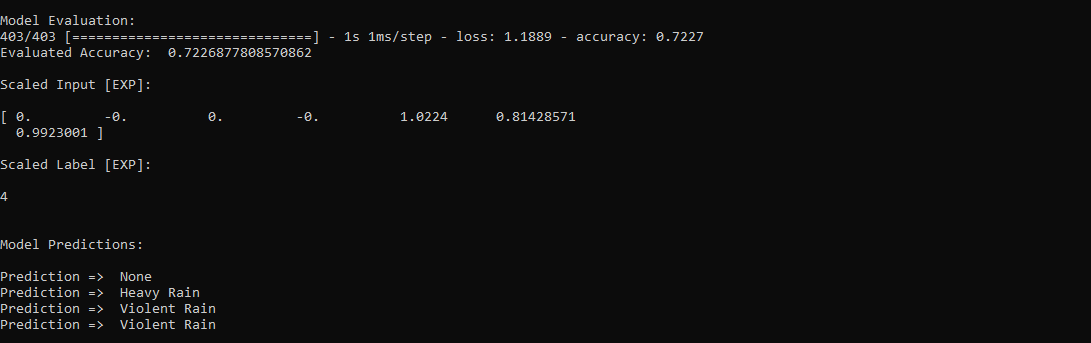
After building and training my artificial neural network model, I tested its accuracy by using the preliminary testing data set.
For now, the evaluated accuracy of the model is between 0.72 and 0.73 due to inadequate testing data set overfitting the model. However, I am still collecting weather data to improve the model accuracy.
...

 # Test the accuracy:
 print("\n\nModel Evaluation:")
 test_loss, test_acc =self.model.evaluate(self.test_input, self.test_label)
 print("Evaluated Accuracy:", test_acc)
Then, I used my neural network model to make predictions on the rainfall intensity with a given prediction array consisting of readings from the weather station after the training of the model. As a starting point, the model works fine :)
The model predicts possibilities of labels for each input element as an array of 5 numbers. They represent the model's "confidence" that the given input element corresponds to each of the five different classes of rainfall intensity [0 - 4].
⭐ In the make_prediction() function, make a prediction for each input element in a given array and get the most accurate label [0 - 4] by using the argmax() function to display its class name.
def make_prediction(self, pre_array):
 print("\n\nModel Predictions:\n")
 prediction =self.model.predict(pre_array)
 for i in range(len(pre_array)):
 print("Prediction => ", self.class_names[np.argmax(prediction[i])])
Prediction Inputs:
- [0, 0, 0.31819805, 0.31819805, 0.6988, 0.81498571, 0.99349753]
- [0, -0, 0, -0, 0.8444, 1, 0.96835143]
- [0, 0, 0.45, 0, 0.87577, 0.95857143, 1.00128332]
- [-0, -0, -0, -0, 0.8224, 1.05714286, 0.99279368]
Prediction Outputs:
- 0 [None]
- 3 [Heavy Rain]
- 4 [Violent Rain]
- 4 [Violent Rain]

Connections and Adjustments (ESP8266)
// Connections
// NodeMCU ESP-12E (ESP8266) :
// Weather Station
// VV --------------------------- 5V
// D5 --------------------------- RX
// D6 --------------------------- TX
// G --------------------------- GND
I connected the sensor (converter) board to the NodeMCU ESP-12E (ESP8266) development board and fastened them to a plastic box while collecting weather data at my balcony.
Connections and Adjustments (SIM808)
// Connections
// Arduino Uno:
// SIM808 GPS/GPRS/GSM Shield For Arduino
// D0 --------------------------- RX
// D1 --------------------------- TX
// D12 --------------------------- POWER
// Weather Station
// 5V --------------------------- 5V
// D5 --------------------------- RX
// D6 --------------------------- TX
// GND --------------------------- GND
⭐ Note:D0, D1, D12 pins are occupied by the SIM808 GPS/GPRS/GSM Shield.
⭐ Connect an external battery (7-23V) for the SIM808 module to work properly.
⭐ Attach the GPS antenna and the GSM antenna to the SIM808 shield.
⭐ Insert a SIM card into the SIM slot on the SIM808 shield.
⭐ Before uploading the code, set the function switch on the shield to None (1).
⭐ Upload the code.
⭐ Then, set the function switch to Arduino (3).
⭐ Press the Boot button on the shield until seeing the Net indicator LED flashing every 1 second and wait for the SIM card to register the network - the Net indicator LED will slowly flash every 3 seconds.
⭐ Click here to get more information about the SIM808 GSM/GPS/GPRS Shield.
After setting up the SIM808 shield with Arduino Uno, I connected the sensor (converter) board to it.
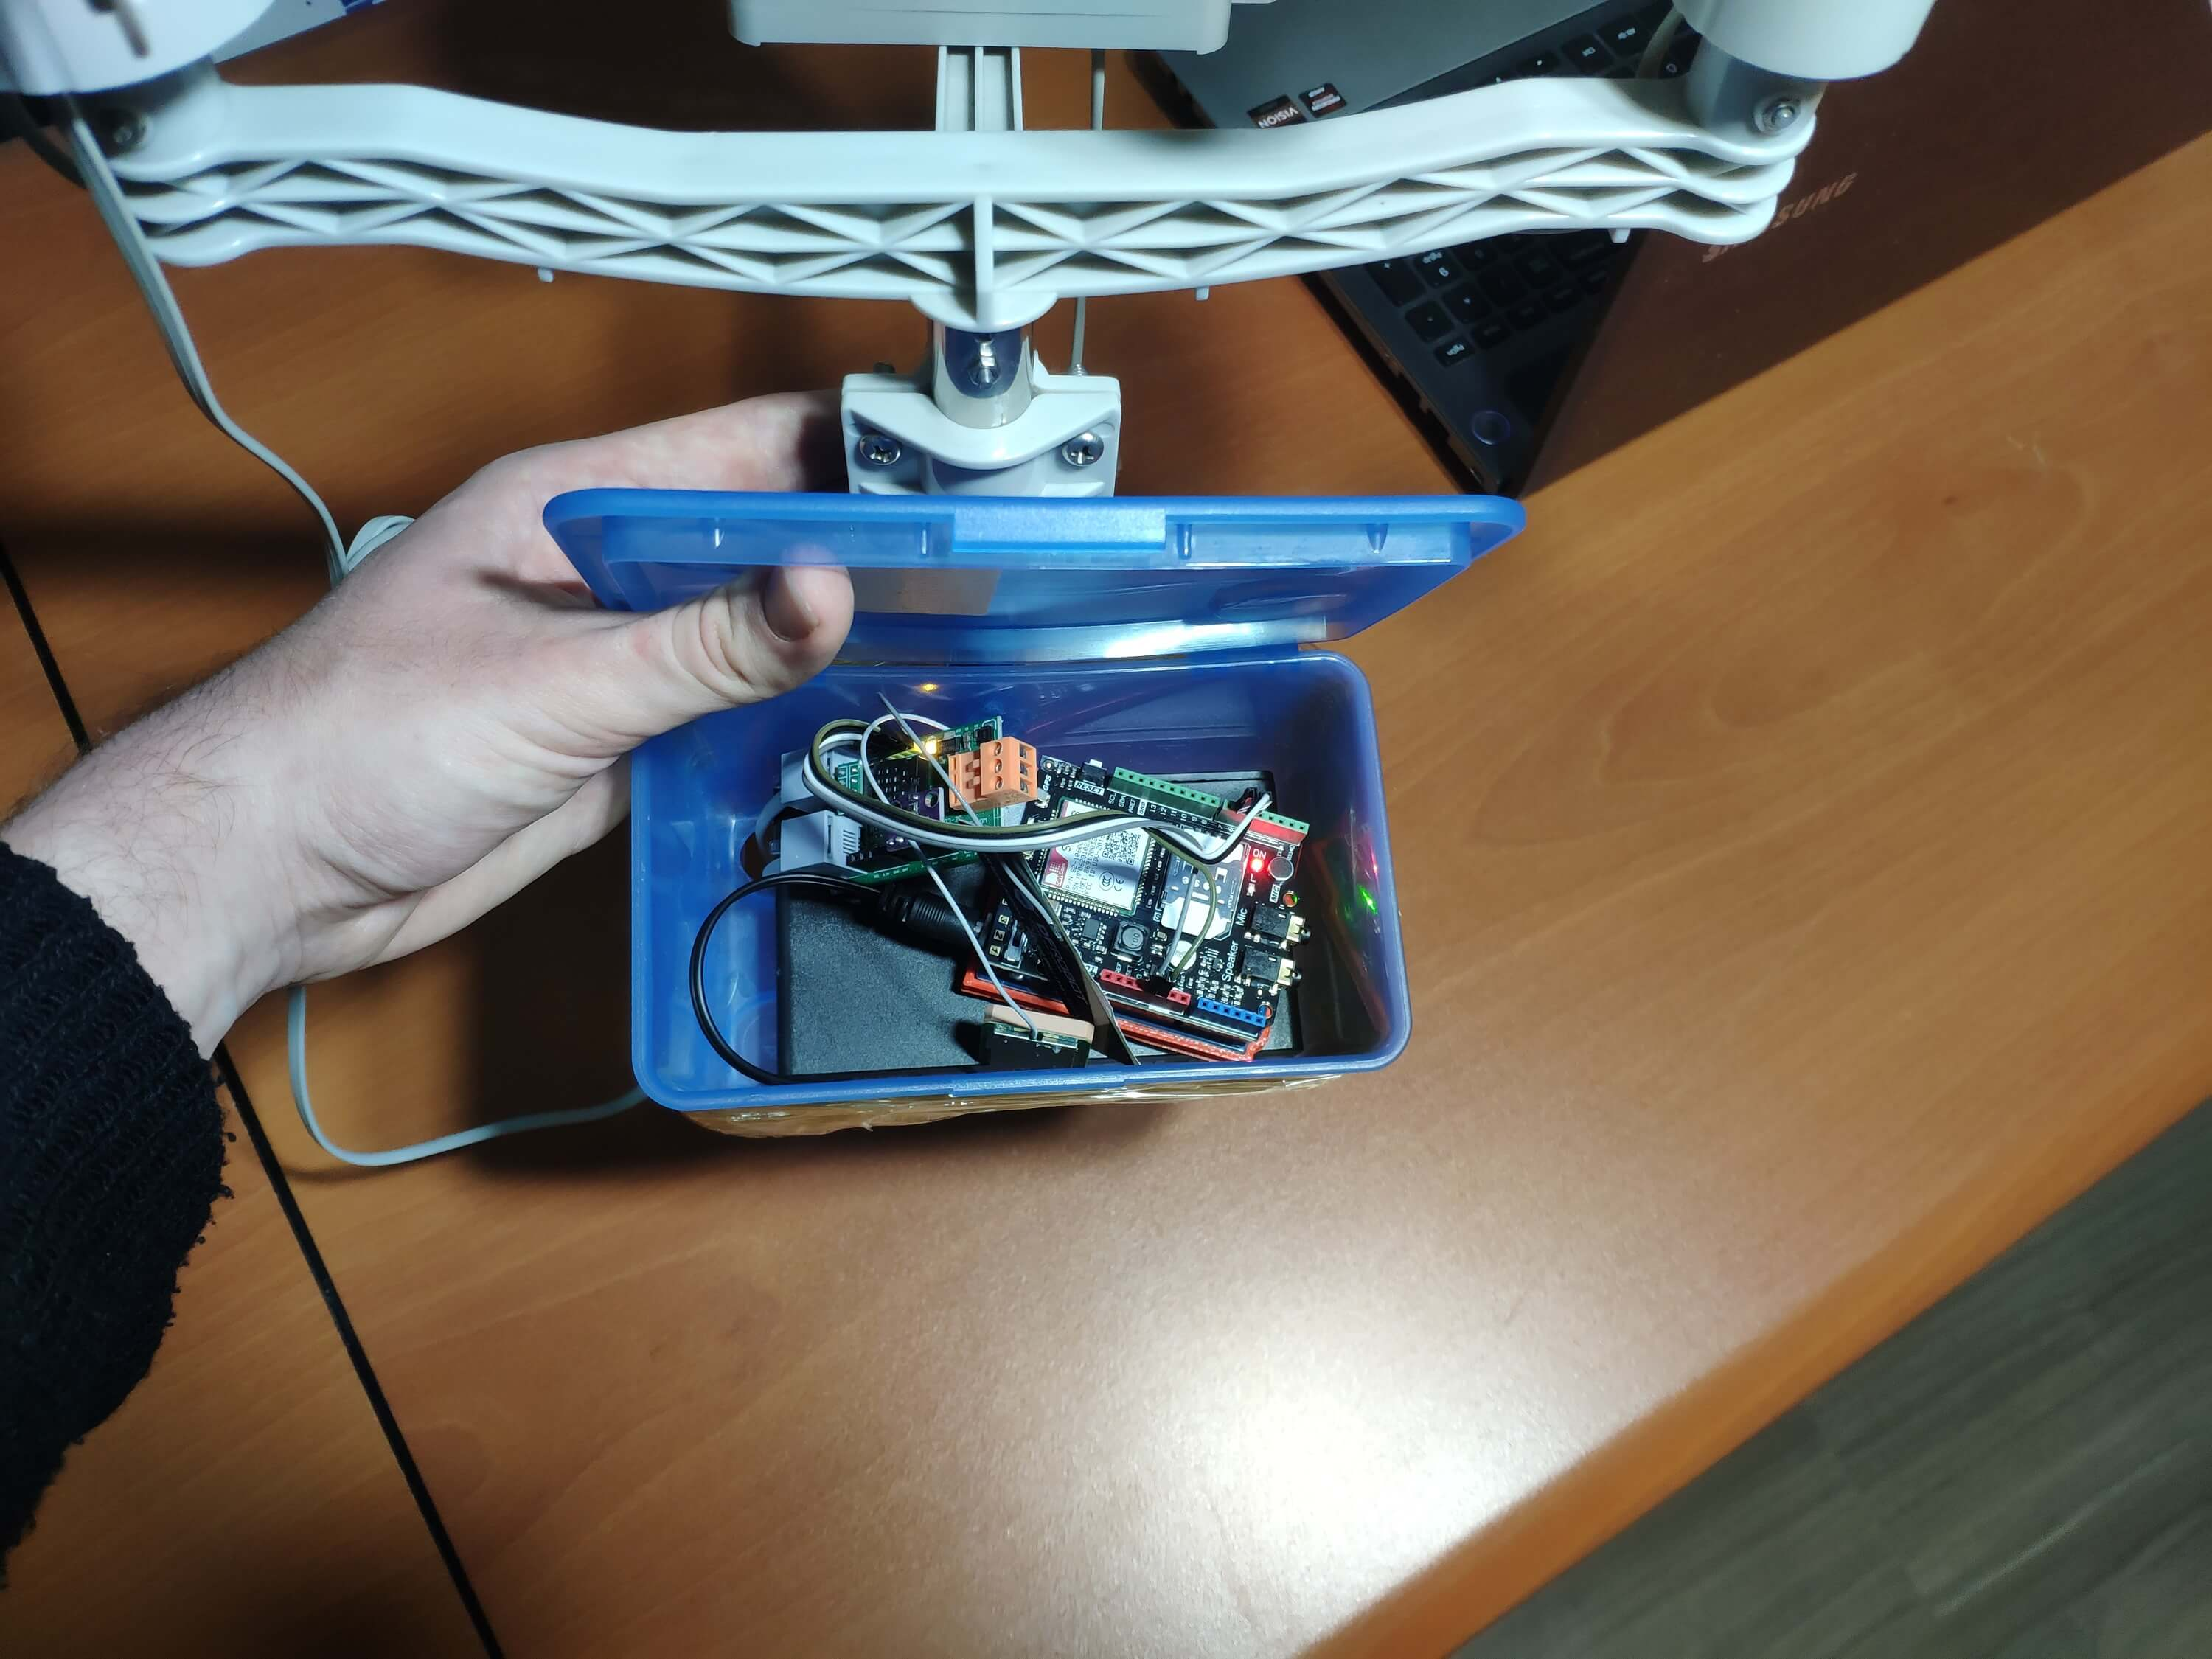
I placed all components into a plastic box to collect weather data outside, even in extreme weather conditions, since the sensor board is not weather-proof.
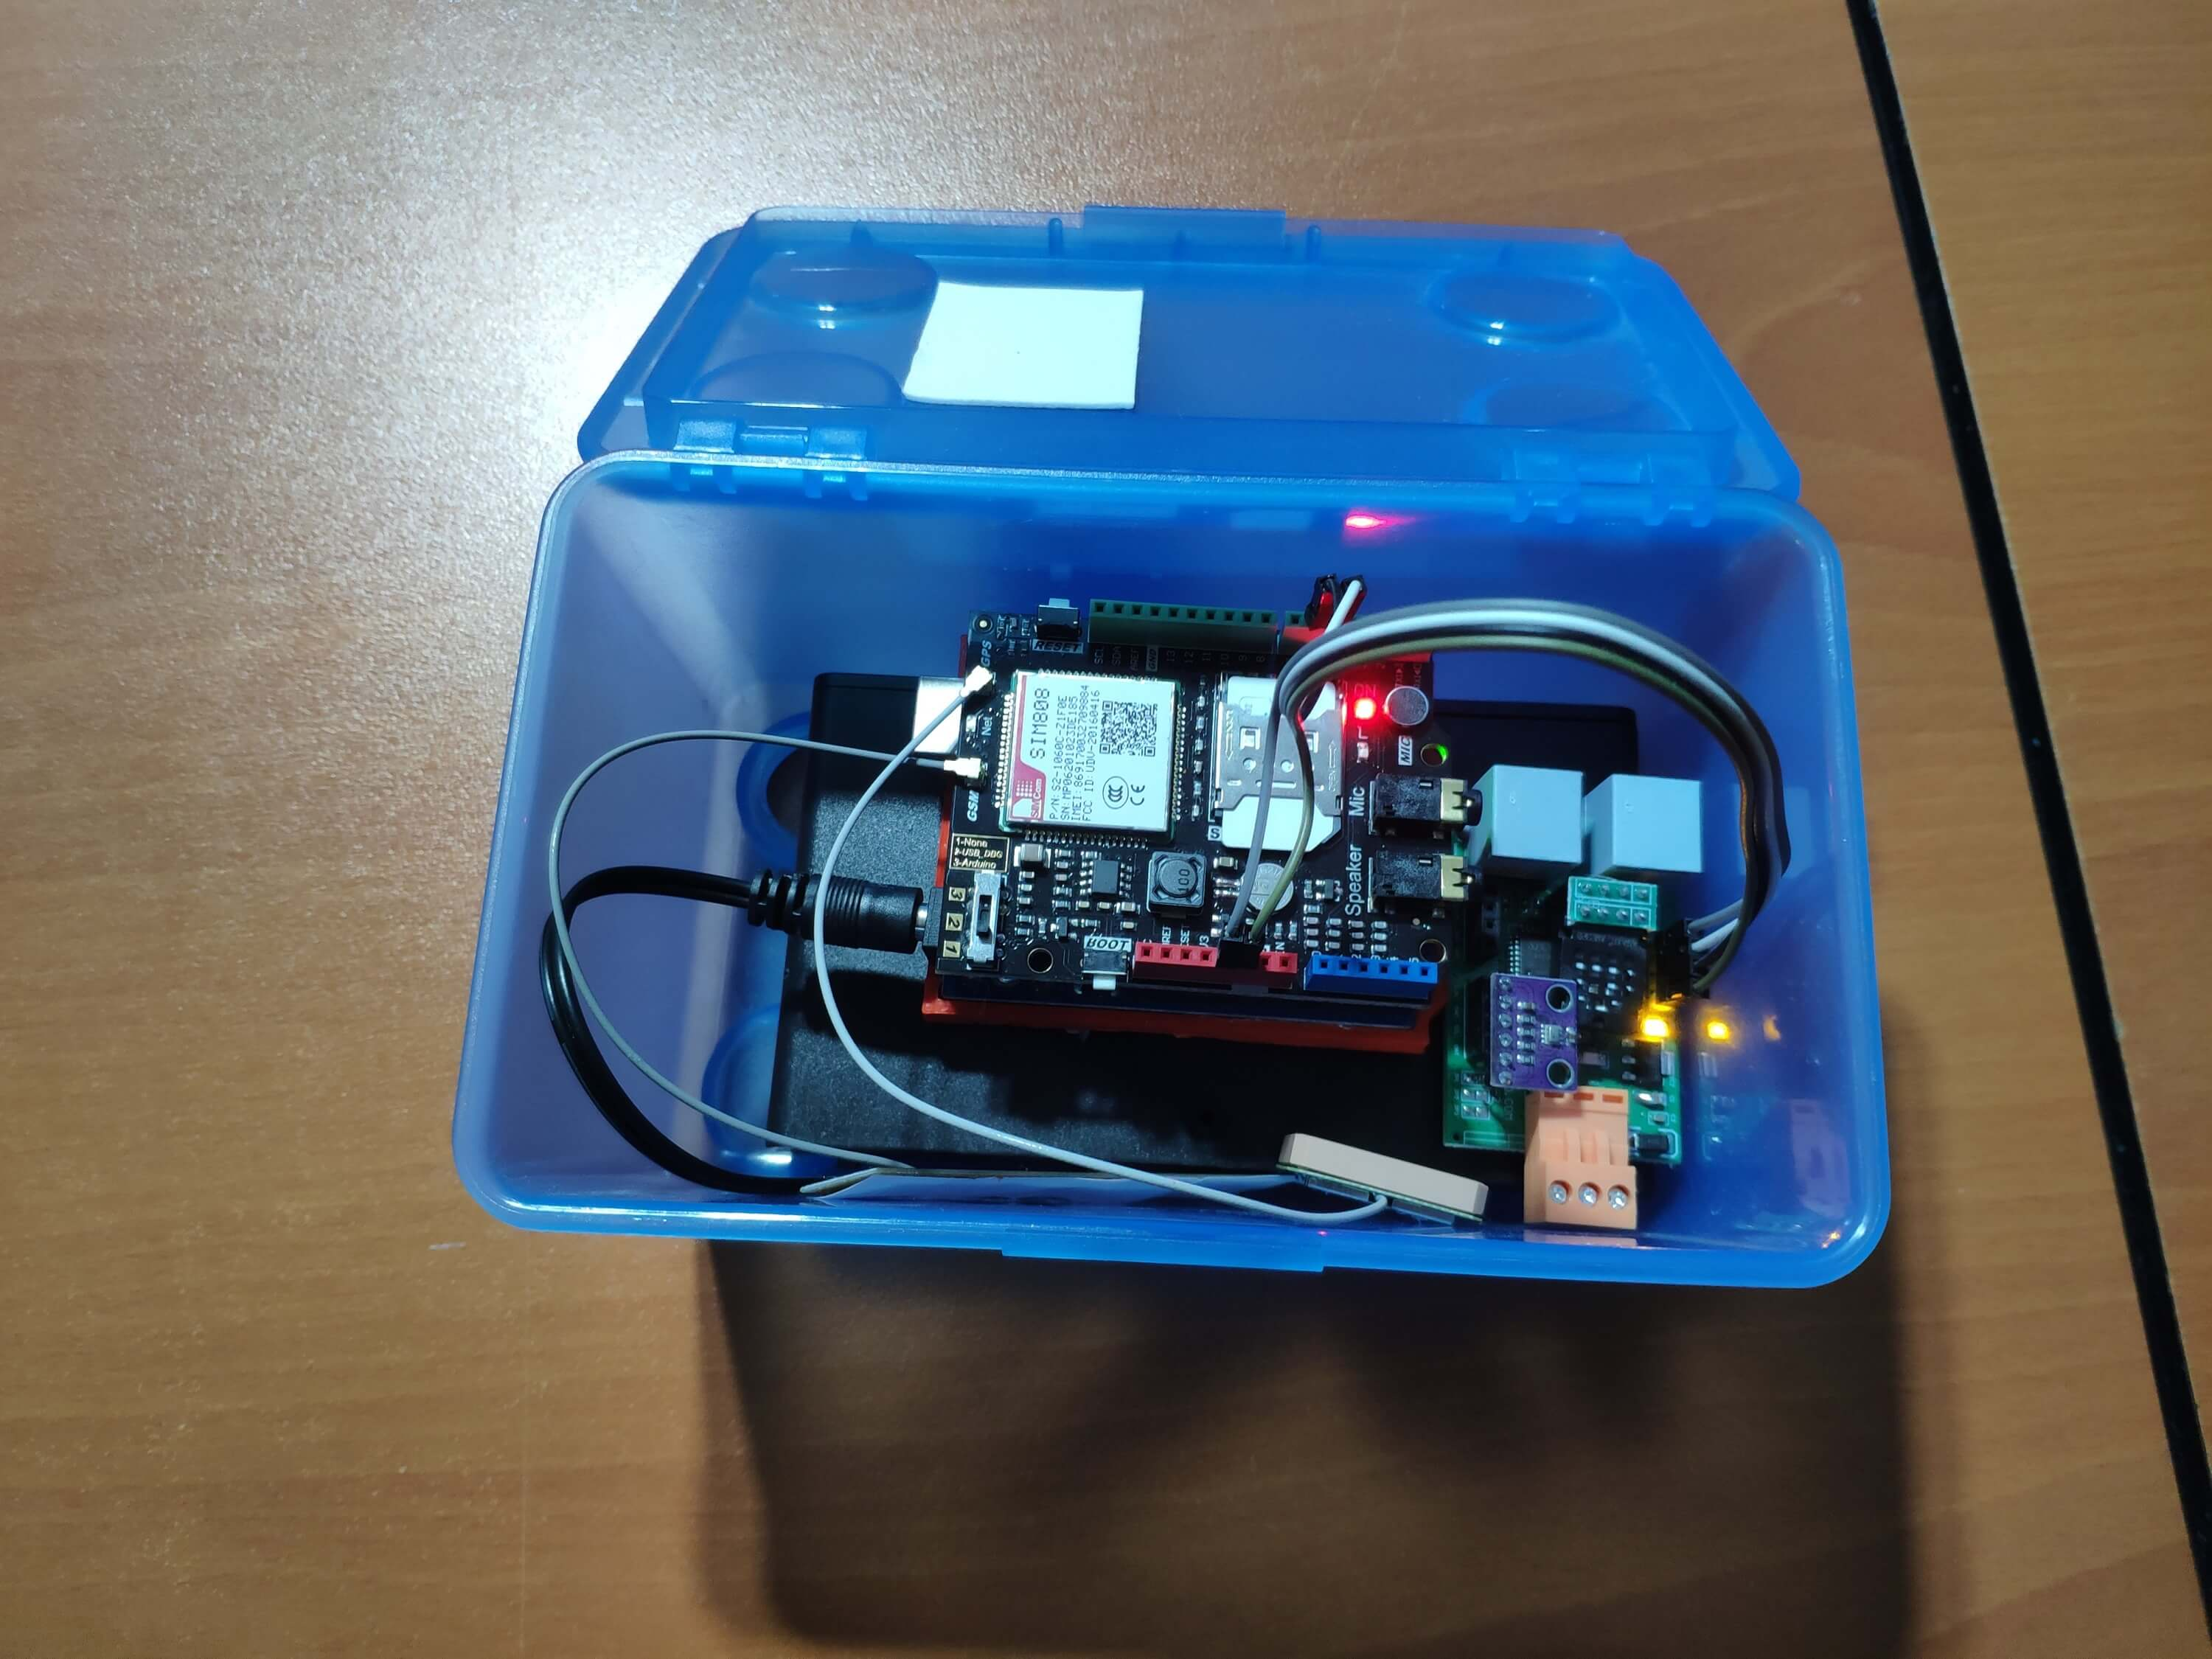
Then, I fastened the plastic box to the weather station.
Videos and Conclusion
After completing coding and assembling the weather station, I collated local weather data for more than three months every five minutes to build my neural network model successfully.
I am still collecting weather data at my balcony and backyard to improve my neural network model and its accuracy :)
Further Discussions
☔ 💧 Since we need local weather data sets to get more accurate predictions on weather phenomena, budget-friendly NN-enabled weather stations like this can be placed on farms and greenhouses to avert the detrimental effects of excessive rainfall on agriculture.
☔ 💧 As early warning systems working with neural networks, we can use them simultaneously to create a swarm of weather stations communicating and feeding each other to forecast rainfall intensity precisely in local areas.
☔ 💧 Also, we can utilize that information for assessing:
- vital water resources,
- agriculture,
- crop productivity,
- ecosystems,
- hydrology.
References
[1] Extreme weather - heavy rainfall , NIWA, https://niwa.co.nz/natural-hazards/extreme-weather-heavy-rainfall
[2] University of Illinois at Urbana-Champaign, News Bureau. "Excessive rainfall as damaging to corn yield as extreme heat, drought. " ScienceDaily. ScienceDaily, 30 April 2019. www.sciencedaily.com/releases/2019/04/190430121744.htm.
[3] Andrew Culclasure, Using Neural Networks to Provide Local Weather Forecasts , Georgia Southern University, Spring 2013, 29https://digitalcommons.georgiasouthern.edu/cgi/viewcontent.cgi?article=1031&context=etd.
Código
- IoT_weather_station_neural_network.py
- ESP12E_remote_weather_station.ino
- SIM808_remote_weather_station.ino
- index.php (web application)
- account_verification_token.php (web application)
IoT_weather_station_neural_network.pyPython
# IoT Weather Station Predicting Rainfall Intensity w/ TensorFlow# Windows, Linux, or Ubuntu# By Kutluhan Aktar# Collates weather data on Google Sheets and interprets it with a neural network built in TensorFlow to make predictions on the rainfall intensity. # For more information:# https://www.theamplituhedron.com/projects/IoT_Weather_Station_Predicting_Rainfall_Intensity_with_TensorFlowimport tensorflow as tffrom tensorflow import kerasimport matplotlib.pyplot as pltimport numpy as npimport pandas as pd# Create a class to build a neural network after getting, visualizing, and scaling (normalizing) weather data.class Weather_Station:def __init__(self, data):self.df =data self.input =[] self.label =[] # Define class names for different rainfall intensity predictions and values. self.class_names =['None', 'Light Rain', 'Moderate Rain', 'Heavy Rain', 'Violent Rain'] # Create graphics for requested columns. def graphics(self, column_1, column_2, xlabel, ylabel):# Show requested columns from the data set:plt.style.use("dark_background") plt.gcf().canvas.set_window_title('IoT Weather Station') plt.hist2d(self.df[column_1], self.df[column_2]) plt.colorbar() plt.xlabel(xlabel) plt.ylabel(ylabel) plt.title(xlabel) plt.show() # Visualize data before creating and feeding the neural network model. def data_visualization(self):# Inspect requested columns to build a model with appropriately formatted data:self.graphics('WD', '1h_RF', 'Wind Direction (deg)', 'One-Hour Rainfall (mm)') self.graphics('Av_WS', '1h_RF', 'Average Wind Speed (m/s)', 'One-Hour Rainfall (mm)') self.graphics('Mx_WS', '1h_RF', 'Maximum Wind Speed (m/s)', 'One-Hour Rainfall (mm)') self.graphics('24h_RF', '1h_RF', '24-Hour Rainfall (mm)', 'One-Hour Rainfall (mm)') self.graphics('Tem', '1h_RF', 'Temperature (C)', 'One-Hour Rainfall (mm)') self.graphics('Hum', '1h_RF', 'Humidity (%)', 'One-Hour Rainfall (mm)') self.graphics('b_PR', '1h_RF', 'Barometric Pressure (hPA)', 'One-Hour Rainfall (mm)') # Scale (normalize) data depending on the neural network model. def scale_data(self):# Wind Direction and Speed:wv =self.df.pop('Av_WS') max_wv =self.df.pop('Mx_WS') # Convert to radians. wd_rad =self.df.pop('WD')*np.pi / 180 # Calculate the wind x and y components. self.df['scaled_WX'] =wv*np.cos(wd_rad) self.df['scaled_WY'] =wv*np.sin(wd_rad) # Calculate the max wind x and y components. self.df['scaled_max_WX'] =max_wv*np.cos(wd_rad) self.df['scaled_max_WY'] =max_wv*np.sin(wd_rad) # Temperature:tem =self.df.pop('Tem') self.df['scaled_Tem'] =tem / 25 # Humidity:hum =self.df.pop('Hum') self.df['scaled_Hum'] =hum / 70 # Barometric Pressure:bPR =self.df.pop('b_PR') self.df["scaled_bPR"] =bPR / 1013 # 24 Hour Rainfall (Approx.) rain_24 =self.df.pop('24h_RF') self.df['scaled_24h_RF'] =rain_24 / 24 # Define the input and label arrays. def create_input_and_label(self):n =len(self.df) # Create the input array using the scaled variables:for i in range(n):self.input.append(np.array([self.df['scaled_WX'][i], self.df['scaled_WY'][i], self.df['scaled_max_WX'][i], self.df['scaled_max_WY'][i], self.df['scaled_Tem'][i], self.df['scaled_Hum'][i], self.df['scaled_bPR'][i]])) self.input =np.asarray(self.input) # Create the label array using the one-hour and 24-hour rainfall variables:for i in range(n):_class =0 # Evaluate the approximate rainfall rate:approx_RF_rate =(self.df['1h_RF'][i] + self.df['scaled_24h_RF'][i]) * 100 # As labels, assign classes of rainfall intensity according to the approximate rainfall rate (mm):if approx_RF_rate ==0:_class =0 elif approx_RF_rate <2.5:_class =1 elif 2.5 ", self.class_names[np.argmax(prediction[i])]) # Save the model for further usage without training steps:def save_model(self):self.model.save("E:\PYTHON\weather_station.h5") # Run Artificial Neural Network (ANN):def Neural_Network(self, save):self.scale_data() self.create_input_and_label() self.split_data() self.build_and_train_model() if save ==True:self.save_model() # Example Input and Layer:print("\nScaled Input [EXP]:\n") print(self.train_input[0]) print("\nScaled Label [EXP]:\n") print(self.train_label[0]) # Read data (Remote Weather Station.csv):csv_path ="E:\PYTHON\Remote Weather Station.csv"df =pd.read_csv(csv_path)# Define a new class object named 'station':station =Weather_Station(df)# Visualize data:#station.data_visualization()# Artificial Neural Network (ANN):station.Neural_Network(False)# Enter inputs for making predictions:prediction_array =np.array([ [0, 0, 0.31819805, 0.31819805, 0.6988, 0.81498571, 0.99349753], [0, -0, 0, -0, 0.8444, 1, 0.96835143], [0, 0, 0.45, 0, 0.87577, 0.95857143, 1.00128332], [-0, -0, -0, -0, 0.8224, 1.05714286, 0.99279368]])# Prediction Results:station.make_prediction(prediction_array) ESP12E_remote_weather_station.inoArduino
///////////////////////////////////////////// // IoT Weather Station Predicting // // Rainfall Intensity w/ TensorFlow // // ------------------------ // // NodeMCU (ESP-12E) // // by Kutluhan Aktar // // // ///////////////////////////////////////////////// Collates weather data on Google Sheets and interprets it with a neural network built in TensorFlow to make predictions on the rainfall intensity. //// For more information:// https://www.theamplituhedron.com/projects/IoT_Weather_Station_Predicting_Rainfall_Intensity_with_TensorFlow//// Connections// NodeMCU (ESP-12E) :// Weather Station// VV --------------------------- 5V// D5 --------------------------- RX// D6 --------------------------- TX// G --------------------------- GND// Include required libraries:#include#include #include #include #include // Define your WiFi settings.const char *ssid =" ";const char *password =" ";// Define weather station settings:char databuffer[35];double temp;int transferring =0;// Define the serial connection pins - RX and TX.SoftwareSerial Serial_1(D6, D5); // (Rx, Tx)void setup() { // Wait until connected. retraso (1000); // Initiate serial ports:Serial.begin(115200); Serial_1.begin(9600); // It is just for assuring if connection is alive. WiFi.mode(WIFI_OFF); retraso (1000); // This mode allows NodeMCU to connect any WiFi directly. WiFi.mode(WIFI_STA); // Connect NodeMCU to your WiFi. WiFi.begin(ssid, password); Serial.print("\n\n"); Serial.print("Try to connect to WiFi. Please wait! "); Serial.print("\n\n"); // Halt the code until connected to WiFi. while (WiFi.status() !=WL_CONNECTED) { delay(500); Serial.print("*"); } // If connection is successful:Serial.print("\n\n"); Serial.print("-------------------------------------"); Serial.print("\n\n"); Serial.print("Connection is successful!"); Serial.print("\n\n"); Serial.print("Connected WiFi SSID :"); Serial.print(ssid); Serial.print("\n\n"); Serial.println("Connected IPAddress :"); Serial.println(WiFi.localIP()); Serial.print("\n\n");}void loop() { // Get data from the remote weather station:getBuffer(); // Debug the information and create the link:String weather_data ="wd=" + String(WindDirection()) + "&a_ws=" + String(WindSpeedAverage()) + "&m_ws=" + String(WindSpeedMax()) + "&1_rf=" + String(RainfallOneHour()) + "&24_rf=" + String(RainfallOneDay()) + "&tem=" + String(Temperature()) + "&hum=" + String(Humidity()) + "&b_pr=" + String(BarPressure()); String server ="http://192.168.1.24/remote_weather_station/?"; Serial.println("Weather Data => " + weather_data); Serial.println("Buffer => " + String(databuffer)); // Send data packets every 5 minutes to Raspberry Pi (or any server). transferring++; Serial.println("Time => " + String(transferring) + "s / " + String(int(5*60)) + "s\n\n"); if(transferring ==5*60){ // Create the HTTP object to make a request to the server. HTTPClient http; http.begin(server + weather_data); int httpCode =http.GET(); String payload =http.getString(); Serial.println("Data Send...\nHTTP Code => " + String(httpCode) + "\nServer Response => " + payload + "\n\n"); http.end(); transferring =0; } // Wait 1 second... delay(1000);}// WEATHER STATIONvoid getBuffer(){ int index; for (index =0;index <35;index ++){ if(Serial_1.available()){ databuffer[index] =Serial_1.read(); if (databuffer[0] !='c'){ index =-1; } } else{ index --; } }}int transCharToInt(char *_buffer, int _start, int _stop){ int _index; int result =0; int num =_stop - _start + 1; int _temp[num]; for (_index =_start;_index <=_stop;_index ++){ _temp[_index - _start] =_buffer[_index] - '0'; result =10*result + _temp[_index - _start]; } return result;}int WindDirection(){ return transCharToInt(databuffer,1,3); } // Wind Direction (deg)float WindSpeedAverage(){ temp =0.44704 * transCharToInt(databuffer,5,7); return temp; } // Average Air Speed (1 minute)float WindSpeedMax(){ temp =0.44704 * transCharToInt(databuffer,9,11); return temp; } //Max Air Speed (5 minutes)float Temperature(){ temp =(transCharToInt(databuffer,13,15) - 32.00) * 5.00 / 9.00; return temp; } // Temperature ("C")float RainfallOneHour(){ temp =transCharToInt(databuffer,17,19) * 25.40 * 0.01; return temp; } // Rainfall (1 hour)float RainfallOneDay(){ temp =transCharToInt(databuffer,21,23) * 25.40 * 0.01; return temp; } // Rainfall (24 hours)int Humidity(){ return transCharToInt(databuffer,25,26); } // Humidity (%)float BarPressure(){ temp =transCharToInt(databuffer,28,32); return temp / 10.00; } // Barometric Pressure (hPA)
SIM808_remote_weather_station.inoArduino
///////////////////////////////////////////// // IoT Weather Station Predicting // // Rainfall Intensity w/ TensorFlow // // ------------------------ // // Arduino Uno (SIM808) // // by Kutluhan Aktar // // // ///////////////////////////////////////////////// Collates weather data on Google Sheets and interprets it with a neural network built in TensorFlow to make predictions on the rainfall intensity. //// For more information:// https://www.theamplituhedron.com/projects/IoT_Weather_Station_Predicting_Rainfall_Intensity_with_TensorFlow//// Connections// Arduino Uno:// SIM808 GPS/GPRS/GSM Shield For Arduino// D0 --------------------------- RX// D1 --------------------------- TX// D12 --------------------------- POWER // Weather Station// 5V --------------------------- 5V// D5 --------------------------- RX// D6 --------------------------- TX// GND --------------------------- GND// Include required libraries:#include#include // Define the sim808.DFRobot_SIM808 sim808(&Serial);// Define weather station settings:char databuffer[35];double temp;int transferring =0;// Define the serial connection pins - RX and TX.SoftwareSerial Serial_1(6, 5); // (Rx, Tx)void setup() { // Wait until connected. retraso (1000); // Initiate serial ports:Serial.begin(9600); Serial_1.begin(9600); //******** Initialize sim808 module ************* while(!sim808.init()) { delay(1000); Serial.print("Sim808 init error\r\n"); } delay(2000); // Continue if the SIM808 Module is working accurately. Serial.println("Sim808 init success"); delay(5000);}void loop() { // Get data from the remote weather station:getBuffer(); // Debug the information and create the link:String weather_data_1 ="wd=" + String(WindDirection()) + "&a_ws=" + String(WindSpeedAverage()) + "&m_ws=" + String(WindSpeedMax()); String weather_data_2 ="&1_rf=" + String(RainfallOneHour()) + "&24_rf=" + String(RainfallOneDay()) + "&tem=" + String(Temperature()); String weather_data_3 ="&hum=" + String(Humidity()) + "&b_pr=" + String(BarPressure()); Serial.print("Weather Data => " + weather_data_1); Serial.print(weather_data_2); Serial.println(weather_data_3); Serial.println("Buffer => " + String(databuffer)); // Send data packets every 5 minutes to the server. transferring++; Serial.println("Time => " + String(transferring) + "s / " + String(int(5*60)) + "s\n\n"); if(transferring ==5*60){ //*********** Attempt DHCP ******************* while(!sim808.join(F("cmnet"))) { Serial.println("Sim808 join network error!"); retraso (2000); } //************ Successful DHCP **************** delay(5000); Serial.println("Successful DHCP"); //*********** Establish a TCP connection ************ if(!sim808.connect(TCP,"192.168.1.24", 80)) { // Change it with your server. Serial.println("Connection Error"); }else{ Serial.println("Connection OK"); } delay(2000); //*********** Send a GET request ***************** String line ="GET /remote_weather_station/?" + weather_data_1 + weather_data_2 + weather_data_3 + " HTTP/1.0\r\n\r\n"; Serial.println (línea); char buffer[512]; // Convert the line from string to char array to make an HTTP Get Request with the SIM808. char web_hook[110]; String_to_Char(line, 110, web_hook); sim808.send(web_hook, sizeof(web_hook)-1); while (true) { int ret =sim808.recv(buffer, sizeof(buffer)-1); if (ret <=0){ Serial.println("Fetch Over..."); descanso; } // Uncomment to view the response in the serial monitor. /* buffer[ret] ='\0'; Serial.print("Recv:"); Serial.print(ret); Serial.print(" bytes:"); Serial.println(buffer); */ Serial.println("\nData Send"); descanso; } //************* Close TCP or UDP connections ********** sim808.close(); //*** Disconnect wireless connection, Close Moving Scene ******* sim808.disconnect(); // Exit. transferring =0; } // Wait 1 second... delay(1000);}// WEATHER STATIONvoid getBuffer(){ int index; for (index =0;index <35;index ++){ if(Serial_1.available()){ databuffer[index] =Serial_1.read(); if (databuffer[0] !='c'){ index =-1; } } else{ index --; } }}int transCharToInt(char *_buffer, int _start, int _stop){ int _index; int result =0; int num =_stop - _start + 1; int _temp[num]; for (_index =_start;_index <=_stop;_index ++){ _temp[_index - _start] =_buffer[_index] - '0'; result =10*result + _temp[_index - _start]; } return result;}int WindDirection(){ return transCharToInt(databuffer,1,3); } // Wind Direction (deg)float WindSpeedAverage(){ temp =0.44704 * transCharToInt(databuffer,5,7); return temp; } // Average Air Speed (1 minute)float WindSpeedMax(){ temp =0.44704 * transCharToInt(databuffer,9,11); return temp; } //Max Air Speed (5 minutes)float Temperature(){ temp =(transCharToInt(databuffer,13,15) - 32.00) * 5.00 / 9.00; return temp; } // Temperature ("C")float RainfallOneHour(){ temp =transCharToInt(databuffer,17,19) * 25.40 * 0.01; return temp; } // Rainfall (1 hour)float RainfallOneDay(){ temp =transCharToInt(databuffer,21,23) * 25.40 * 0.01; return temp; } // Rainfall (24 hours)int Humidity(){ return transCharToInt(databuffer,25,26); } // Humidity (%)float BarPressure(){ temp =transCharToInt(databuffer,28,32); return temp / 10.00; } // Barometric Pressure (hPA)void String_to_Char(String _String, int _size, char _convert[]){ for(int i=0;i<_size;i++){ _convert[i] =_String[i]; }}
index.php (web application)PHP
 (int)$_GET['wd'], "a_ws" => (float)$_GET['a_ws'], "m_ws" => (float)$_GET['m_ws'], "1_rf" => (float)$_GET['1_rf'], "24_rf" => (float)$_GET['24_rf'], "tem" => (float)$_GET['tem'], "hum" => (int)$_GET['hum'], "b_pr" => (float)$_GET['b_pr'] ];}else{ $variables_from_module =[ "wd" => "err", "a_ws" => "err", "m_ws" => "err", "1_rf" => "err", "24_rf" => "err", "tem" => "err", "hum" => "err", "b_pr" => "err" ];}/** * Returns an authorized API client. * @return Google_Client the authorized client object */function getClient(){ $client =new Google_Client(); $client->setApplicationName('Remote Weather Station'); // Enter your application name. $client->setScopes('https://www.googleapis.com/auth/spreadsheets'); $client->setAuthConfig('credentials.json'); $client->setAccessType('offline'); $client->setPrompt('select_account consent'); // Load previously authorized token from a file, if it exists. // The file token.json stores the user's access and refresh tokens, and is // created automatically when the authorization flow completes for the first // time. $tokenPath ='token.json'; if (file_exists($tokenPath)) { $accessToken =json_decode(file_get_contents($tokenPath), true); $client->setAccessToken($accessToken); print("Token Found!"); } // If there is no previous token or it's expired. if ($client->isAccessTokenExpired()) { // Refresh the token if possible, else fetch a new one. if ($client->getRefreshToken()) { $client->fetchAccessTokenWithRefreshToken($client->getRefreshToken()); } else { // Request authorization from the user. $authUrl =$client->createAuthUrl(); // Do not forget to refresh the page after getting the verification code and entering it to the account_verification_token.php. printf("Open the following link in your browser:

%s

", $authUrl); // <=Comment print 'Do not forget to refresh the page after getting the verification code and entering it to the account_verification_token.php.

Set the verification code in the account_verification_token.php file.'; // <=Comment // Set the verification code to create the token.json. $authCode =trim($GLOBALS['account_verification_token']); // Exchange authorization code for an access token. $accessToken =$client->fetchAccessTokenWithAuthCode($authCode); $client->setAccessToken($accessToken); // Check to see if there was an error and the account_verification_token is entered. if (array_key_exists('error', $accessToken)) { throw new Exception(join(', ', $accessToken)); }else{ print("Successful! Refresh the page."); } } // Save the token to a file. if (!file_exists(dirname($tokenPath))) { mkdir(dirname($tokenPath), 0700, true); } file_put_contents($tokenPath, json_encode($client->getAccessToken())); } return $client;}// Get the API client and construct the service object.$client =getClient();$service =new Google_Service_Sheets($client);// Enter your spreadsheetId:$spreadsheetId ='';// Enter the range (the first row) under which new values will be appended (8 rows):$range ='A1:H1';// Append recent findings from the weather station to the spreadsheet.$values =[ [$variables_from_module["wd"], $variables_from_module["a_ws"], $variables_from_module["m_ws"], $variables_from_module["1_rf"], $variables_from_module["24_rf"], $variables_from_module["tem"], $variables_from_module["hum"], $variables_from_module["b_pr"]]];$body =new Google_Service_Sheets_ValueRange([ 'values' => $values]);$params =[ 'valueInputOption' => "RAW"];// Append if only requested!if(isset($_GET['wd']) &&isset($_GET['a_ws']) &&isset($_GET['m_ws']) &&isset($_GET['1_rf']) &&isset($_GET['24_rf']) &&isset($_GET['tem']) &&isset($_GET['hum']) &&isset($_GET['b_pr'])){ $result =$service->spreadsheets_values->append($spreadsheetId, $range, $body, $params); printf("

%d cells appended.", $result->getUpdates()->getUpdatedCells());}else{ print ("
Missing Data!");}
account_verification_token.php (web application)PHP
"; // Enter the verification code after authorization. ?>
Piezas y carcasas personalizadas
remote_weather_station_OobOCQNPSW.csvEsquemas
Proceso de manufactura
- Estación meteorológica basada en Raspberry Pi
- Estación meteorológica Raspberry Pi 2
- Estación meteorológica Raspberry Pi
- Proyecto IoT 101:Temperatura de transmisión desde su Raspberry Pi
- Monitoreo remoto del clima usando Raspberry Pi
- Únase al IOT con su estación meteorológica - CWOP
- Sensores Java ME 8 + Raspberry Pi + =Mundo IoT (Parte 1)
- Proyecto de IoT basado en Raspberry PI que conecta el sensor DHT11
- Windows 10 IoT Core en Raspberry Pi 2 - Datos del sensor Adafruit
- Weather Station V 2.0
- Windows 10 IoT Core para Raspberry Pi 3 Modelo B +